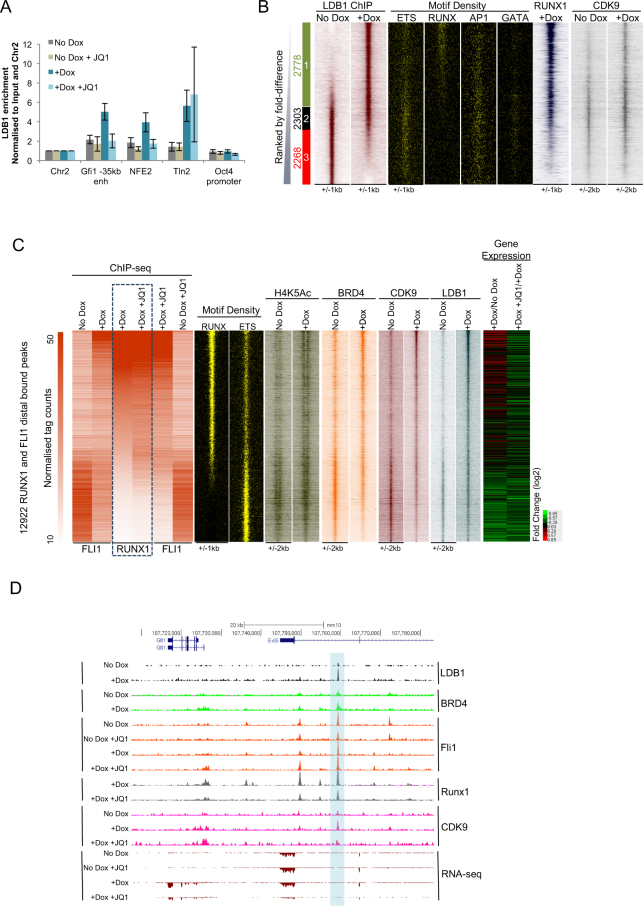
Figure 5.
RUNX1 recruits LDB1 and co-ordinates TF assembly at genes essential for the EHT and haematopoiesis. (A) Manual LDB1 ChIP showing recruitment of LDB1 to regulatory elements known to be bound by RUNX1. Error bars represent standard deviation, n = 3. (B) Heat maps showing enrichment of LDB1 ranked by fold difference between the +Dox and No Dox samples. Peaks were considered to be specific if they showed greater than 2 fold enrichment in one sample compared to the other and are designated as Group1, 2 or 3. The specific/shared groups and the numbers of peaks within these groups are shown alongside. Group 1 (green box) are +Dox-specific LDB1 bound peaks; Group 2 (black box) are occupied by LDB1 in both samples and Group 3 (red box) are No Dox-specific LDB1 bound peaks. Motif density plots for RUNX, ETS, AP1 and GATA motifs and ChIP-seq enrichment for RUNX1 and CDK9 at these sites are also shown along the same coordinates. (C) Heat maps showing RUNX1 (highlighted with dashed line) and FLI1 ChIP-seq normalised tag counts for distal sites bound by RUNX1 and/or FLI1 ranked according to the strength of RUNX1 binding. Also shown for the same regions are: RUNX and ETS motif density plots; H4K5Ac, BRD4, CDK9 and LDB1 ChIP-seq enrichment for these distal sites and gene expression for genes attributed to these sites. (D) Genome browser tracks showing the LDB1, BRD4, FLI1, RUNX1 and CDK9 ChIP-seq enrichment and gene expression at the Gfi1 locus. The shaded region highlights the Gfi1 −35 kb enhancer used for validation in Fig. 5A.

