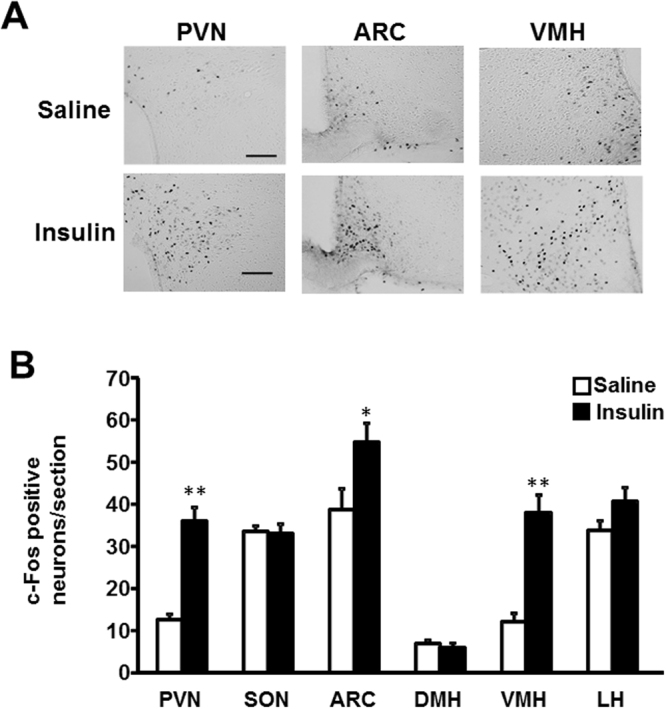
Figure 1.

Effect of insulin on c-Fos expression in the hypothalamus. (A) Representative pictures showing c-Fos expression in the PVN, ARC and VMH of hypothalamus at 90 min after ICV injection of saline or insulin (100 μU/2 μl). Scale bar: 200 μm. (B) Number of c-Fos- immunopositive (IR) neurons per section of the hypothalamic nuclei at 90 min after ICV injection of saline (white bars) or insulin (100 μU/2 μl) (black bars). n = 5. **p < 0.01 and *p < 0.05 vs. saline by one-way ANOVA followed by Tukey’s test. Error bars are SEM.
