Figure 4.
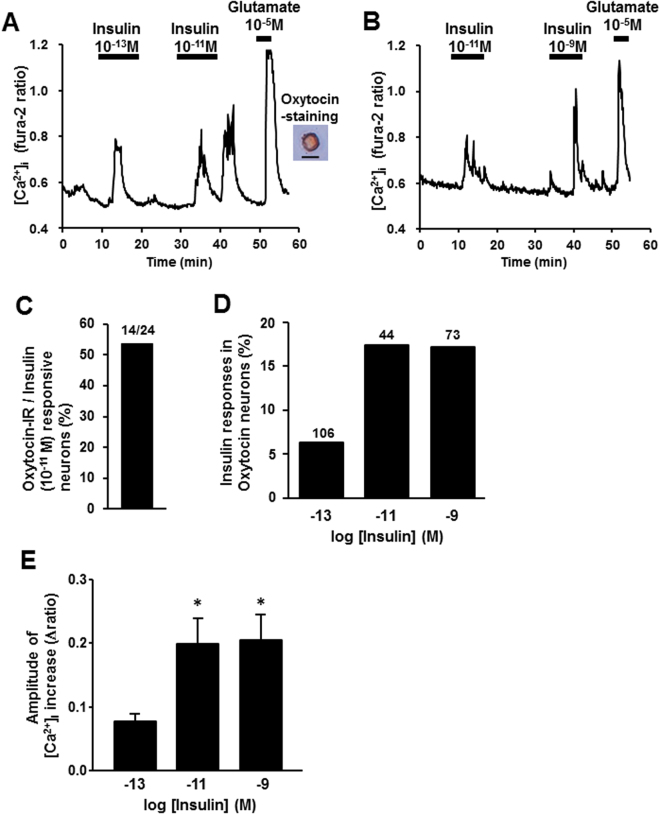
Insulin increases [Ca2+]i in single PVN oxytocin neurons. (A) Insulin at 10−13 M and 10−11 M increased [Ca2+]i (left panel) in a single PVN neuron that was subsequently shown to be IR to oxytocin (right panel). Scale bar is 25 μm. (B) Insulin at 10−11 and 10−9 M increased [Ca2+]i in a single PVN neuron. (C) 14 of 24 (53.8%) neurons that responded to insulin were IR to oxytocin. (D) Incidence of [Ca2+]i responses to insulin in PVN oxytocin neurons, expressed by percentage. Numbers around each point indicate the number of PVN oxy neurons. (E) Average amplitude of insulin-induced [Ca2+]i increases (Δratio) in oxytocin neurons. *p < 0.05 vs. basal level by one-way ANOVA followed by Tukey’s test. Error bars are SEM.

