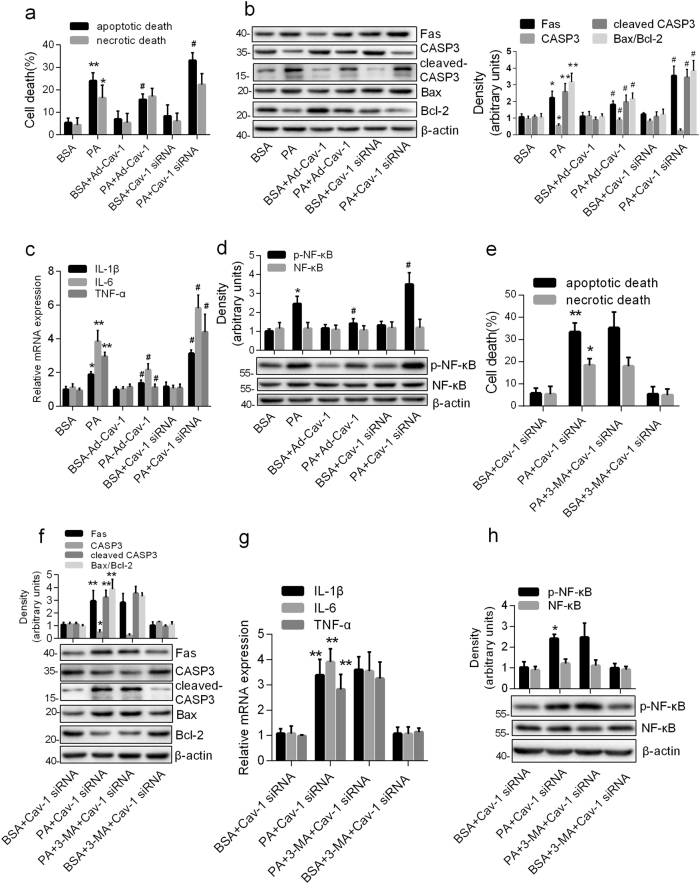
Fig. 4. The degradation of Cav-1 was responsible for PA-induced autophagy-dependent apoptotic cell death and inflammation.
The astrocytes with Cav-1 knockdown or Cav-1 overexpression were incubated with PA (0.25 mM) for 12 h (a–d). a Annexin-V/PI labeling flow cytometry showing the percentages of apoptotic cells (Annexin V+/PI− and Annexin V+/PI+) and necrotic cells (Annexin V−/PI+) (mean ± S.E.M. n = 3/group, *P < 0.05, **P < 0.01 vs. BSA; #P < 0.05 vs. PA). b Western blots showing the expression of Fas, CASP3, cleaved CASP3, and Bax/Bcl-2 ratio. c Real-time qPCR showing the relative mRNA levels of TNF-α, IL-1β, and IL-6. d Western blots showing the p-NF-κB p65 and total NF-κB p65 (mean ± S.E.M. n = 3, *P < 0.05, **P < 0.01 vs. BSA; #P < 0.05 vs. PA). Cav-1-deficient astrocytes were exposed to PA (0.25 mM, 12 h) in the absence and presence of 3-MA (e–g). e Annexin-V/PI labeling flow cytometry showing the percentages of apoptotic cells (Annexin V+/PI− and Annexin V+/PI+) and necrotic cells (Annexin V−/PI+) (mean ± S.E.M. n = 3/group, *P < 0.05 vs. BSA + Cav-1-siRNA). f Western blots showing the expression of Fas, CASP3, cleaved CASP3, and Bax/Bcl-2 ratio. g Real-time qPCR showing the relative mRNA levels of TNF-α, IL-1β, and IL-6. h Western blots showing the p-NF-κB p65 and total NF-κB p65 (mean ± S.E.M. n = 3, *P < 0.05, **P < 0.01 vs. BSA + Cav-1-siRNA)

