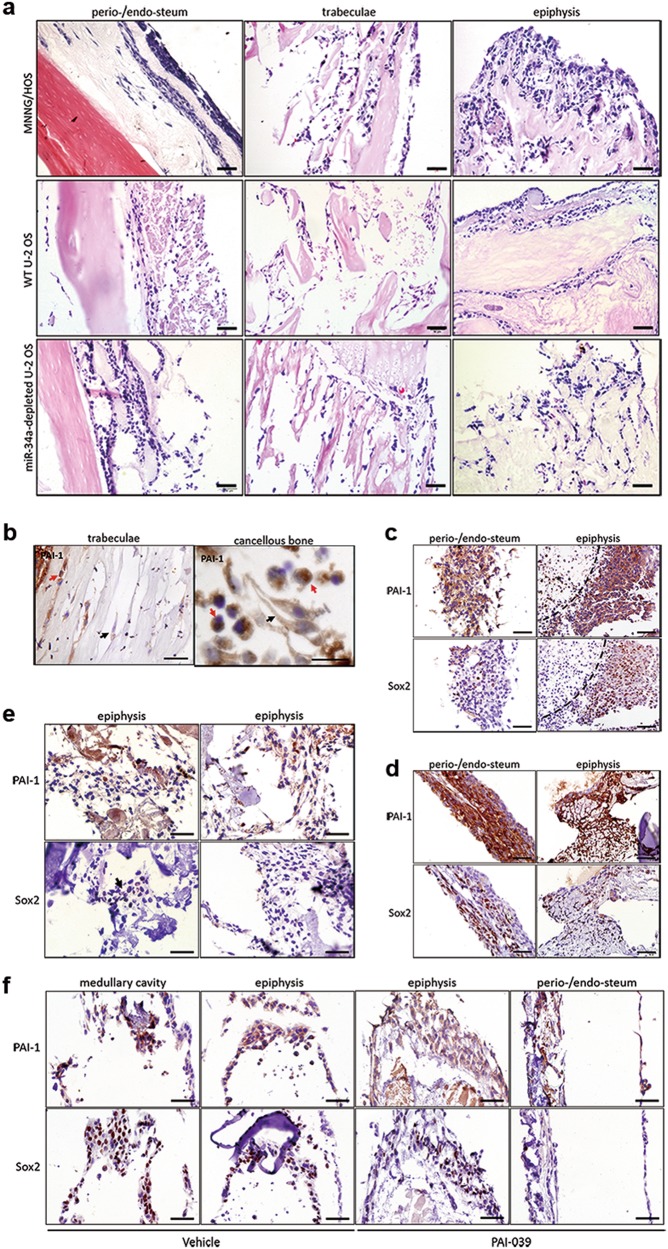
Fig. 6. miR-34a expression correlated to OS phenotypic heterogeneity and high level of PAI-1 expression was in conjunction with Sox2-positive cells.
(a) H&E analysis of the injected OS cells in BEM. Magnified images were shown as an inset. (b) IHC analysis of PAI-1 expression of injected MNNG/HOS cells in BEM. Black arrows pointed out the elongated MNNG/HOS cells and the red arrows pointed out the rounded ones. (c, d) IHC analysis of PAI-1 and Sox2 expression of MNNG/HOS adherent cells (c) and spheroid cells (d). The dotted line indicated the necrotic area and the asterisk denoted non-specific staining, a frequent problem in the apoptotic cells. (e, f) IHC analysis of PAI-1 and Sox2 expression of WT U-2 OS (e) and miR-34a-depleted U-2 OS treated with vehicle or PAI-039 (f). Black arrows indicated the site of Sox2-positive cell subpopulation. Magnified images were shown as an inset. Scale bar = 50 μm

