Figure 1.
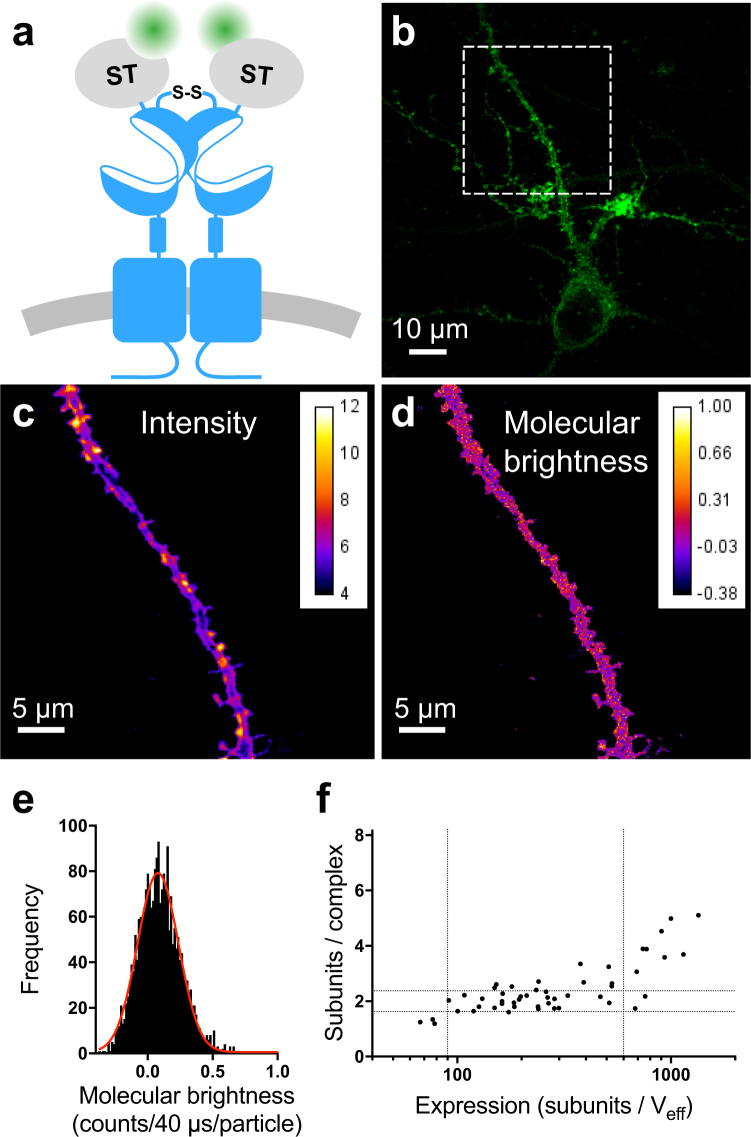
The mGlu2 receptor is mainly dimeric in cultured hippocampal neurons. (a) Schematic representation of the homodimeric mGlu2 receptor N-terminally SNAP-tagged (ST-mGlu2) and labeled with Alexa Fluor 488 (Alexa488). (b) Intensity image by two-photon microscopy of a primary neuron transfected with ST-mGlu2 labeled with Alexa488. The white dashed square represents the area selected for further imaging and analysis. (c) Average intensity map obtained from a stack of 100 images of the dashed square in (b) after thresholding. (d) Molecular brightness (ε, counts/40 μs/molecule) map of the dashed square in (b). (e) Histogram of molecular brightness values corresponding to the map in (d). The center of the distribution is estimated with a Gaussian fit (red line) giving ε = 0.0798 ± 0.0030 or 1.66 ± 0.06 subunits/complex (expression 98 subunits per effective volume (Veff = 0.355 fL)). (f) Number of mGlu2 receptor subunits per complex as a function of subunits per Veff. The vertical dotted lines indicate three expression regimes with different complex sizes. The horizontal dotted lines indicate the molecular brightness of a dimer ± SD. Data are from 14 independent experiments.

