Figure 4.
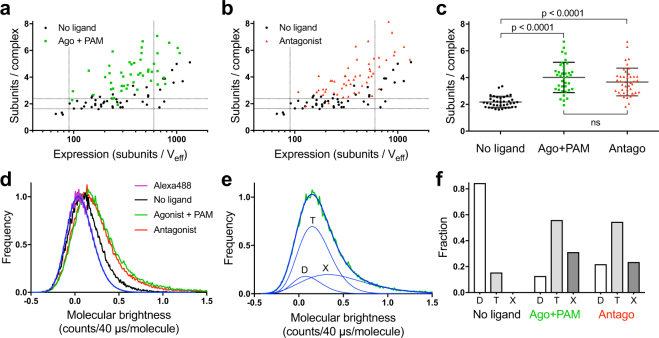
Ligands favor mGlu2 oligomerization. (a,b) Comparison of the mGlu2 receptor stoichiometry as a function of its expression level in the absence of ligand (black) or when bound to agonist and PAM (10 nM LY379268 + 3 μM BINA, green, a) or to antagonist (400 nM LY341495, red, b). (c) Between 90 and 600 subunits/Veff, the mean mGlu2 stoichiometry is 2.2 ± 0.4, 4.0 ± 1.1 and 3.7 ± 1.0 subunits/complex in the absence of ligand, when bound to agonist and PAM or antagonist, respectively (mean ± SD). One-way ANOVA followed by Bonferroni’s multiple comparisons test was used to show that the increased stoichiometries were statistically significant. (d) Normalized accumulation of molecular brightness histograms for monomeric Alexa488 (purple) overlaid with a log-normal fit (blue) and for all neurons with expression in the 90–600 subunits/Veff range in absence of ligand (black) or bound to agonist and PAM (green) or antagonist (red). (e) Example of a fit of the accumulated histogram for mGlu2 bound to agonist and PAM in neurons with expression in the 90–600 subunits/Veff range (from panel d, green). The total fit (thick blue curve) is the sum of three log-normal fits (thin blue curves) corresponding to the population of dimers (D), tetramers (T), and oligomers larger than tetramers (X). The peak values of the dimer and tetramer fits are fixed to multiples of the peak value of monomeric Alexa488. The peak value for larger oligomers was unconstrained. (f) Fraction of the different oligomeric species (D, T and X) under the given conditions calculated from the areas under the individual fit curves. Data are from 11–14 independent experiments.

