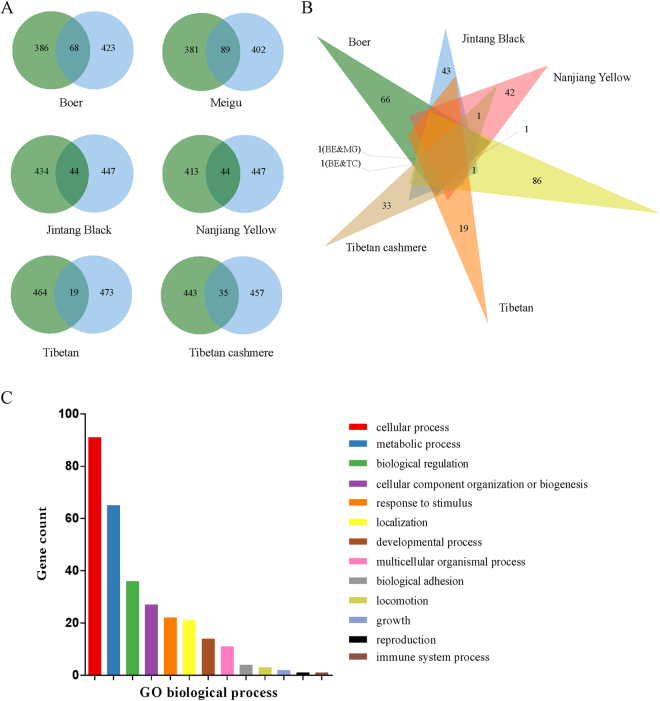
Figure 4.
Summary of the overlapped outlier windows detected via ZFST or ZHp scores. (A) A Venn diagram of the outlier windows detected via ZFST or ZHp scores in six goat breeds, based on their genomic positions. Green circles represent the numbers of the outlier windows detected via ZFST values, while the light blue circles represent the windows identified via ZHp scores. (B) A Venn diagram of the overlapped outlier windows across all the six goat breeds, based on their genomic positions. (C) Summary of the biological processes into which the candidate genes can be classified.

