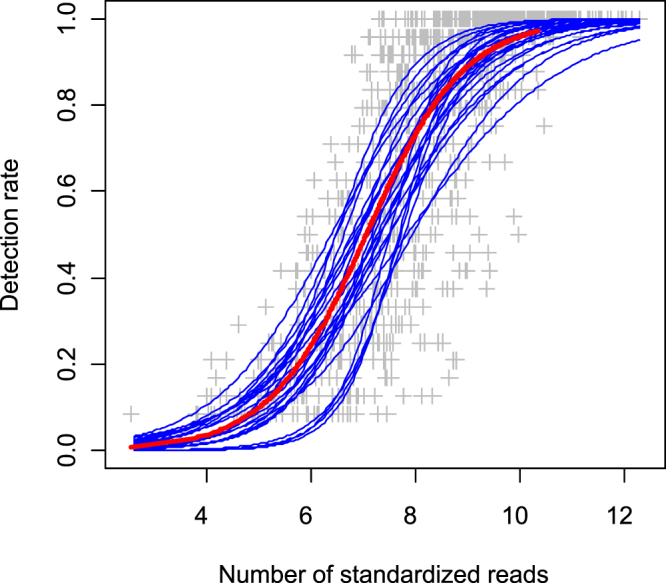
Figure 2.

Relationship between number of standardized reads (in log) and detection rate (frequency of positive PCR) of MOTUs among sites. Grey cross: observed values. Red line: predicted detection rate as a function of the number of standardized reads (glm model). Blue lines: predicted detection rate as a function of the number of standardized reads, MOTU’s identity and their interaction (glm model). List of the 24 MOTUs considered in the second model: Abr_bra, Alb_alb, Alb_bip, Alo_spp, Ang_ang, Bar_bar, Bli_bjo, Cor_lav, Cot_sp, Cyp_car, Cypr_1, Eso_luc, Lep_gib, Leu_spp, Liz_ram, Onc_myk, Perc_flu, Pho_pho, Pse_par, Rho_ser, Sal_spp, Sal_tru San_luc, Sil_gla (see Supplementary Table 2 for the species names corresponding to the abbreviations).
