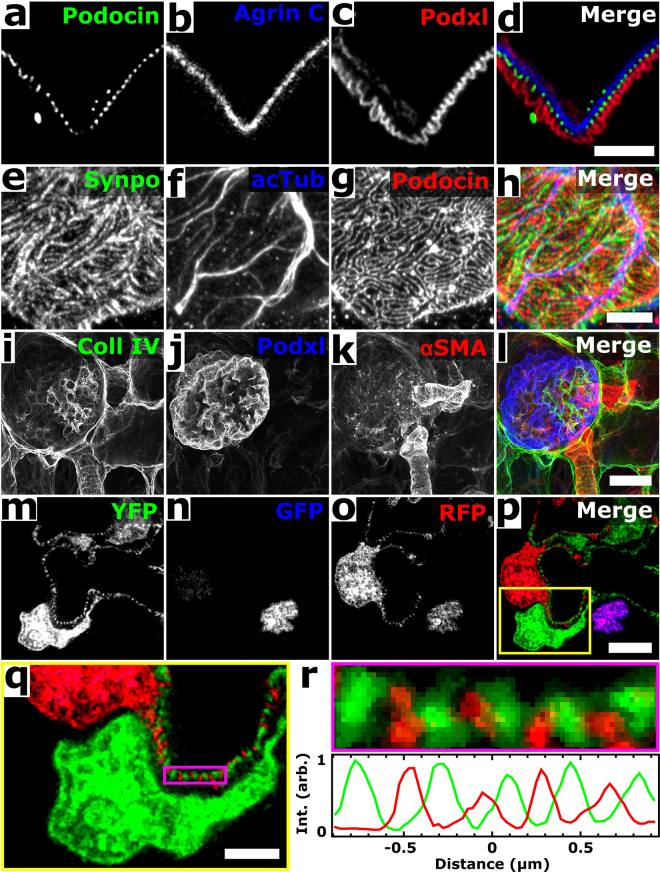
Figure 2.
Confocal ExM images of mouse kidney labeled with antibodies or fluorescent proteins. (a–c) Single focal plane of glomerulus immunostained for podocin (a), agrin (b), podocalyxin (Podxl c), and merge (d) of (a–c). (e–g) Confocal maximum intensity projections of glomerulus immunostained for synaptopodin (Synpo, e), acetylated tubulin (acTub, f), podocin (g) highlighting secondary FPs, primary FPs, and slit diaphragms/FP boundaries, respectively. (h) Merge of (e–h). (i–k) Confocal maximum intensity projections of glomerulus immunostained for collagen IV (Coll IV, i), podocalyxin (Podxl, j), and α smooth muscle actin (αSMA, k) and highlighting Bowman’s capsule and the mesangium, podocytes, and arterioles and the mesangium, respectively. (l) Merge of (i–k). (m–p) Single focal plane of glomerulus showing native fluorescence from confetti mouse expressing YFP (m) and RFP (o) in separate podocyte cell bodies and FPs as well as GFP (n) in various podocyte nuclei. (p) Merge of (m–o). (q) Zoomed-in view of region highlighted in (p). (r) Further zoomed-in view (top) and cross-sectional profile (bottom) of boxed region highlighted in (q). All distances and scale bars are in pre-expansion units. Scale bars, 2 µm (a–h,q), 25 µm (i–l), 5 µm (m–p).

