Figure 4.
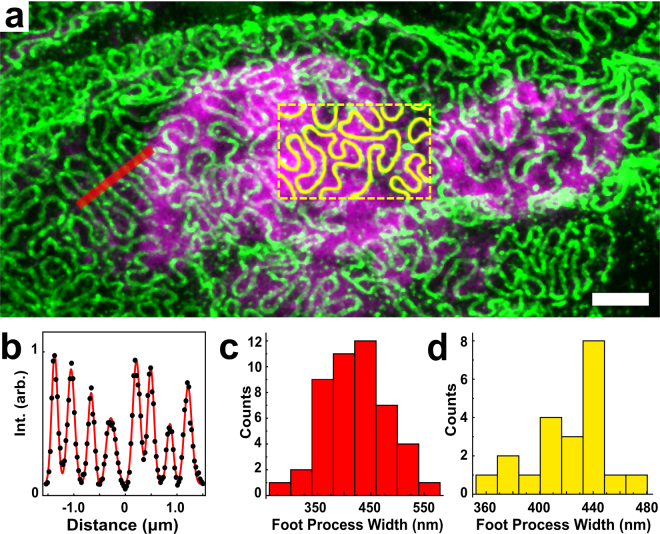
Confocal ExM images of expanded human kidney tissue. (a) Human kidney immunostained for podocin (green) with nuclei stained by Hoechst (magenta). (b) Cross-sectional profile along the red line in (a) and fitted with multiple Gaussian functions (black dots are data, and red curve is result of Gaussian fitting). (c) Histogram of foot process widths determined by a set of peak-to-peak distances in (a). (d) Histogram of foot process widths measuring by tracing podocin signal within a given area as in the yellow boxed region in (a), as described in the text. All distances and scale bars are in pre-expansion units. Scale bar, 2 μm (a).

