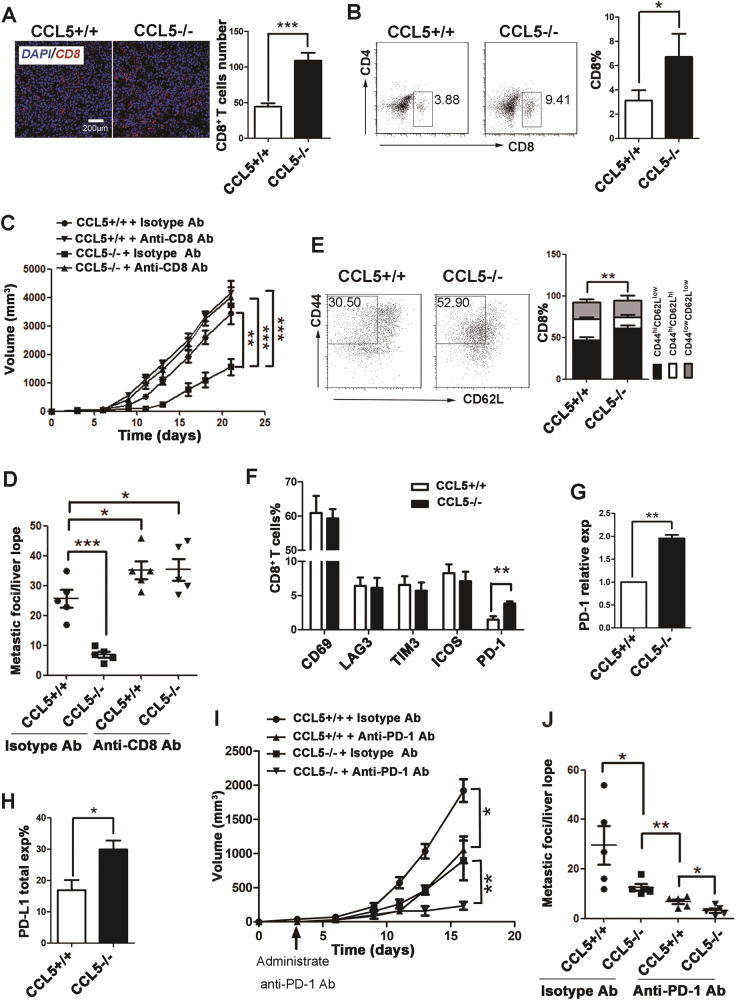
Fig. 2. The phenotype of CD8+ T cells and decreased resistance to anti-PD-1 Ab in CCL5−/− mice.
a Representative histological staining (left) and analysis (right) of CD8 in frozen section from the tumor of CCL5+/+ or CCL5−/− mice. b Representative flow cytometry plot (left) and analysis (right) of CD8+ T cells percentage in TILs of control group CCL5+/+ or CCL5−/− mice. n = 5 mice per group. c The tumor growth curves of CT26shNTC and CT26shCCL5 tumor cells were injected into the back of female WT or KO mice treated with CD8 T-cell-depleting antibody. Tumor growth was monitored every 2–3 days. d Quantitation of liver metastasis determined by counting of foci per liver lobe. Each group contained five mice. e Representative flow cytometry plot (left) and analysis (right) of effector CD8+ T cells percentage among CD8+ cells in TILs of CCL5+/+ or CCL5−/− mice. Bar chart shows the FACS quantification of effector (CD8+CD44hiCD62Llow), memory (CD8+CD44hiCD62Lhi), and naïve (CD8+CD44lowCD62Llow) T-cell subpopulations. f FACS quantification of the percentage of CD69+, LAG3+, TIM3+, ICOS+, PD-1+ cells among CD8+ T cells in TILs of CCL5+/+ or CCL5−/− mice. g RT-PCR quantification of relative PD-1 mRNA expression in CD8+ T cells in TILs. h FACS quantification of the percentage of PD-L1+ cells in TILs. i The tumor growth curves of CT26shNTC and CT26shCCL5 tumor cells were injected into the back of female WT or KO mice. Mice received anti-PD-1 monoclonal antibody i.p. on days 3, 6, 9, 12 post tumor injection. Tumor growth was monitored every 2–3 days. j Quantitation of liver metastasis determined by counting of foci per liver lobe after tumor burden of 40 days. Each group contained five mice. *P < 0.05, **P < 0.05, ***P < 0.001. Data are represented as mean ± SEM; n = 5 mice per group

