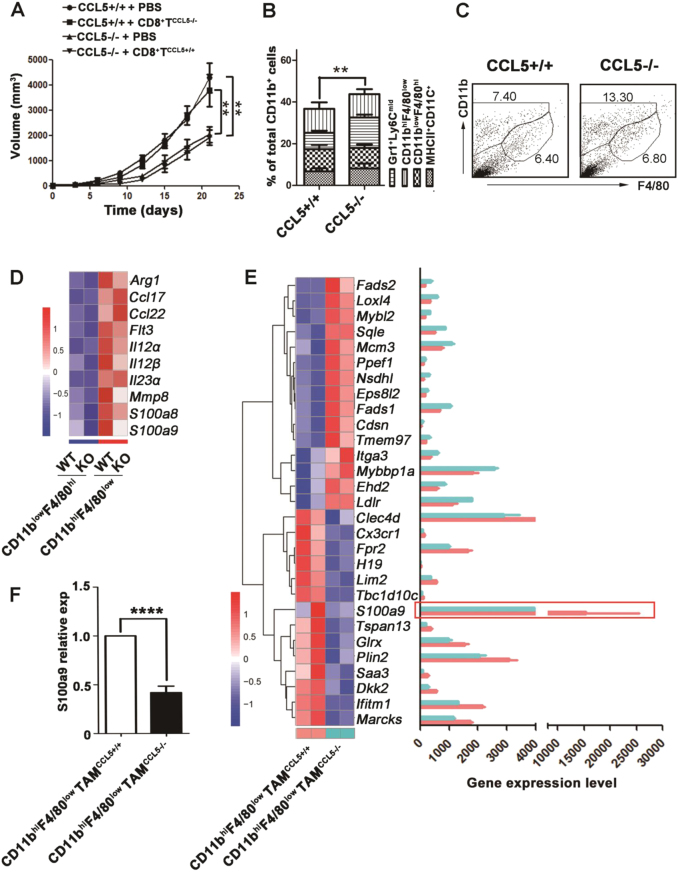
Fig. 3. The phenotype of CD11bhiF4/80low TAMs is changed in CCL5−/− mice.
a At 7 and 12 days following the initial tumor challenge, adoptive transfer of CD8+ T cells (6×10⁶) was done. Tumor growth was measured 2–3 times a week. b Flow cytometry analysis of myeloid populations of TILs. n = 5 mice per group. c Flow cytometry analysis of TAMs in tumor from CCL5+/+ or CCL5−/− mice. d Transcriptomic profiling and gene expression level of CD11blowF4/80hi TAMs and CD11bhiF4/80low TAMs by RNA-seq, which were separated from the tumor of CCL5+/+ and CCL5−/− mice. e Transcriptomic profiling and gene expression level of CD11bhiF4/80low TAMsCCL5+/+ and CD11bhiF4/80low TAMsCCL5−/− by RNA-seq. f RT-PCR quantification of S100a9 gene relative expression in CD11bhiF4/80low TAMsCCL5+/+ and CD11bhiF4/80low TAMsCCL5−/−. **P < 0.01, ****P < 0.0001. Data are represented as mean ± SEM

