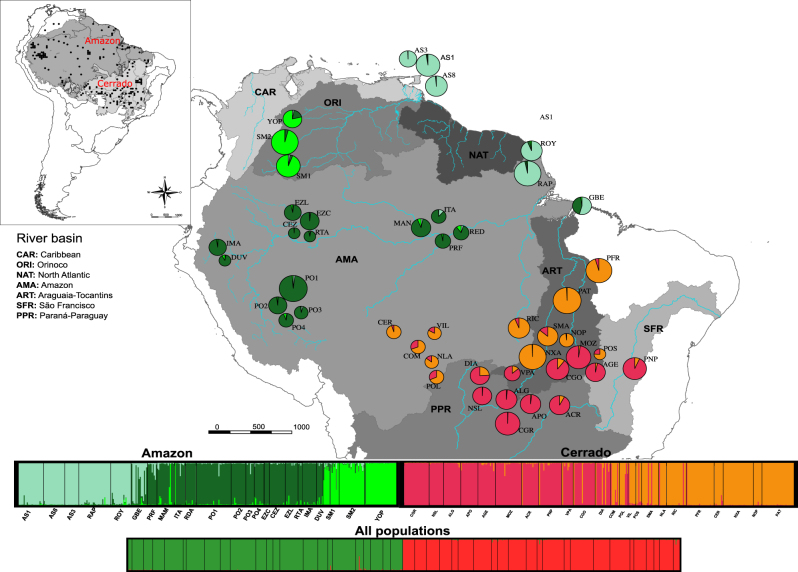
Fig. 1.
Geographical distribution of the 46 Mauritia flexuosa populations sampled and Bayesian clustering of individuals. Different colours were assigned to different clusters following the figure legends. The lower bar plot (all populations) shows the two clusters (K = 2) when Bayesian analysis was performed considering the 46 populations. The upper bar shows the three clusters for the Amazonia biome (K = 3) and the two clusters for the Cerrado biome (K = 2). For population codes see Supporting Information Table S1. The inset map shows the geographic distribution of M. flexuosa based on the occurrence records (black dots) of GBIF (https://www.gbif.org). The shape file of river basins was obtained from HydroBASINS v. 1c (Lehner and Grill 2013)

