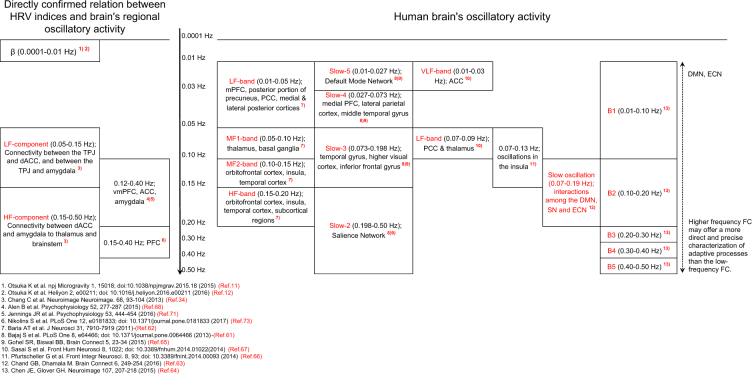
Figure 2.
Relationship between HRV indices in different frequency ranges and brain’s regional oscillatory activity. BOLD signals measure brain oscillatory activity by studying changes in spectral power within various frequency bands during resting-state and stimulus-evoked activity. Resting-state fMRI studies showed BOLD fluctuations indicative of functional integration between brain regions occurring over multiple frequency bands, from slow-5 (0.01–0.027 Hz) to slow-1 (0.50–0.75 Hz). Dynamic functional connectivity patterns are tightly linked to adaptive behavior25. Resting-state networks consist of frequency-specific subcomponents, shifts in power of brain oscillations during a task occur in specific frequency bands in brain-specific regions. Frequencies in the 0.10–0.20 Hz range play a significant role for functional connectivity61. Oscillation in the 0.07–0.19 Hz range mediate the interaction within and between the DMN, SN and ECN nodes63. Slow-3 frequency band (0.073–0.198 Hz) reflects intrinsic oscillations in the insula61,63,65,66. HRV varies in concert with changes in brain functional connectivity; the heart and brain are connected bi-directionally. HRV may serve as a proxy for ‘vertical integration’ of the brain system21 in which DMN plays an important role in adaption to microgravity. HRV activity is associated with structures and functions of brain’s DMN, SN and ECN neural networks34.

