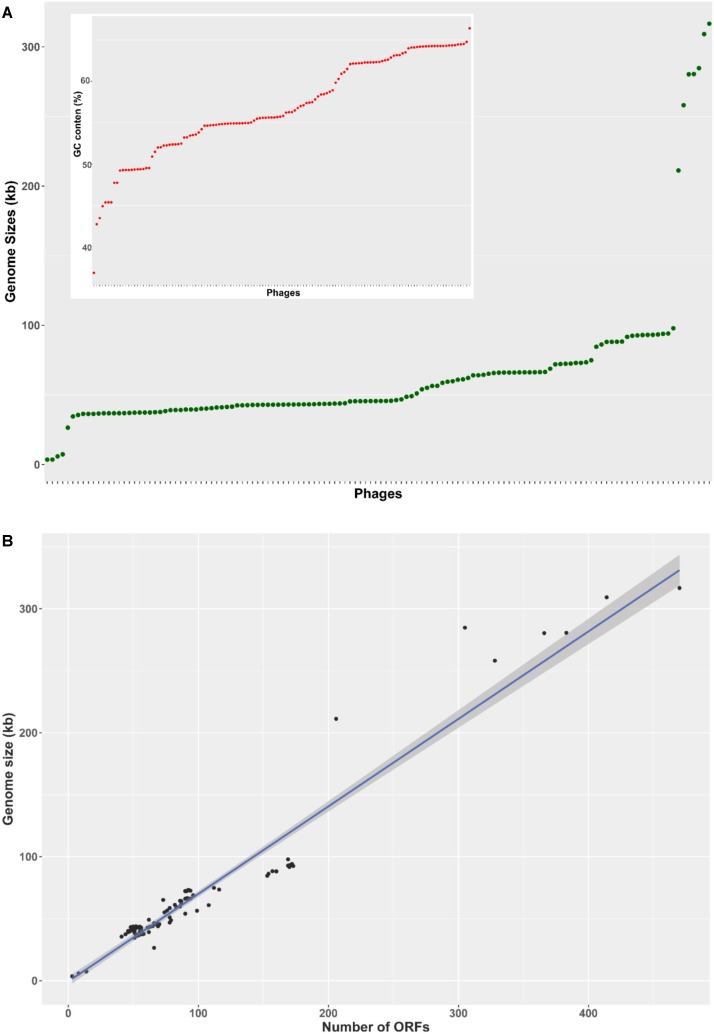
FIGURE 1.
Genome characteristics of 130 Pseudomonas phages. (A) A rank-ordered plot of genomes sizes reveals a range of 3–316 kb and only a few genomes larger than 100 kb. Phages were rank-ordered on the X axis based on the property identified on the Y axis. (B) The number of predicted ORFs in phage genomes showed a strong, statistically significant correlation with genome size (R2 = 0.936, p < 0.001). The shading denoted 95% confident interval of the linear correlation (C). A ranked plot of G + C content reveals a range of 37–66%.

