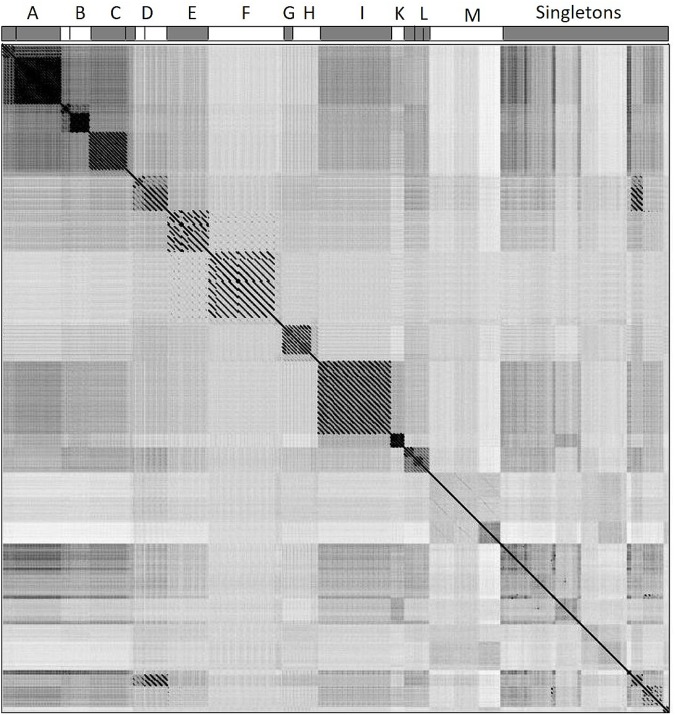
FIGURE 2.
Whole-genome dot plot comparison of phage nucleotide sequences. All 130 genomes were concatenated into a single sequence, then plotted against itself with a sliding window of 10 bp and visualized by Gepard 1.40. 111 phage genomes were assigned to 12 clusters (A–M) and 30 phage genomes remained singletons. The assignment of phages to clusters A–M is shown at the top horizontal axis.

