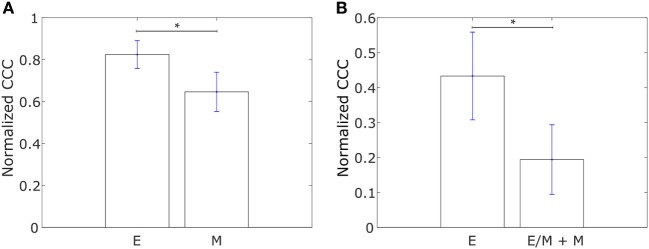
Figure 3.
Normalized cophenetic correlation coefficient of the inflammatory breast cancer-associated gene network for (A) 13 epithelial (E) and 11 mesenchymal cell lines from the study by Grosse-Wilde et al. (39), and (B) 11 epithelial (E) and 47 hybrid epithelial-mesenchymal (E/M) + mesenchymal (M) cell lines from the NCI60 dataset (41, 42). Error bars indicate the SE in the estimate of CCCnorm calculated using the bootstrap method. *p-Value < 0.05.

