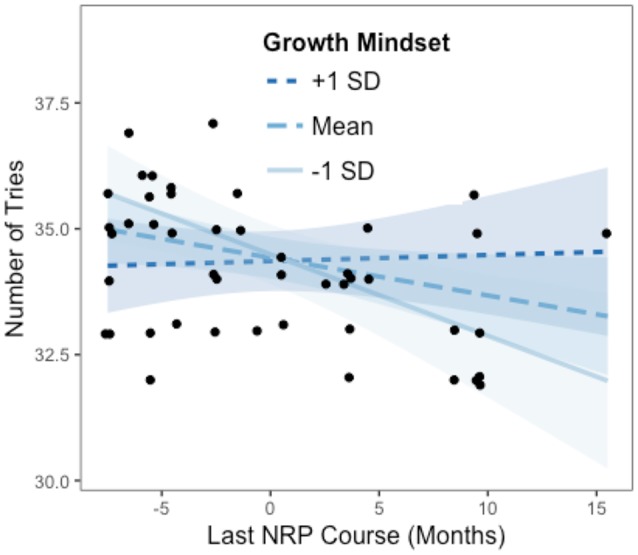
Figure 3.

Johnson-Neyman interaction effect of the linear regression model. The x-axis represents the centered variable Last NRP Course and the y-axis represents the number of tries in the RETAIN game. Participants who took an NRP course more recently (i.e., when the value of Last NRP Course on the x axis is lower than zero which represents the average of 8.69 months) required significantly more tries to complete the game than the rest of the participants, but only when they endorsed lower levels of Growth Mindset (i.e., at the mean or one standard deviation below the mean).
