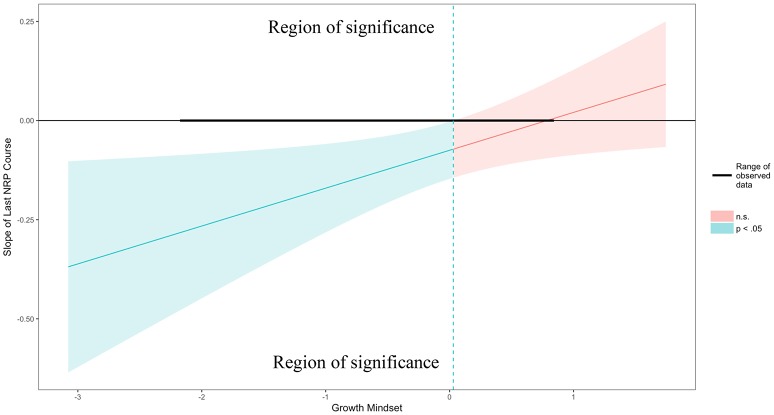
Figure 4.
Probing interactions with the Johnson-Neyman (J-N) technique for continuous variables. The y axis represents the conditional slope of Last NRP Course predictor, while the x axis represents units of standard deviation of the Growth Mindset moderator. The plot shows where the conditional slope differs significantly from zero. The light blue area on the left of the vertical dotted line between the 95% confidence bands represents the region of significance where the effect of the Last NRP Course on the Number of Tries is significantly moderated by Growth Mindset (i.e., this effect only exists when Growth Mindset is lower than or equal to 0.03 represented by the vertical dotted line). The dark horizontal line indicates the actual range of Last NRP Course observed in the sample data: [−2.17, 0.83].

