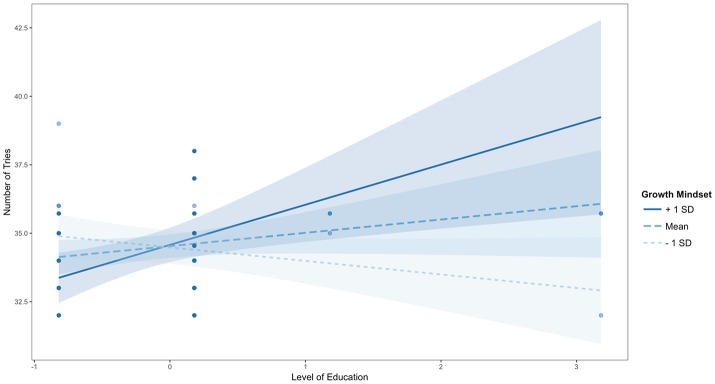
Figure 5.
Johnson-Neyman interaction effect of the linear regression model. The x-axis represents the centered variable Level of Education and the y-axis represents the number of tries in the RETAIN game. Participants with lower levels of education completed the game in fewer tries than participants with higher levels of education but only when they endorsed higher levels of growth mindset (i.e., one standard deviation above the mean).

