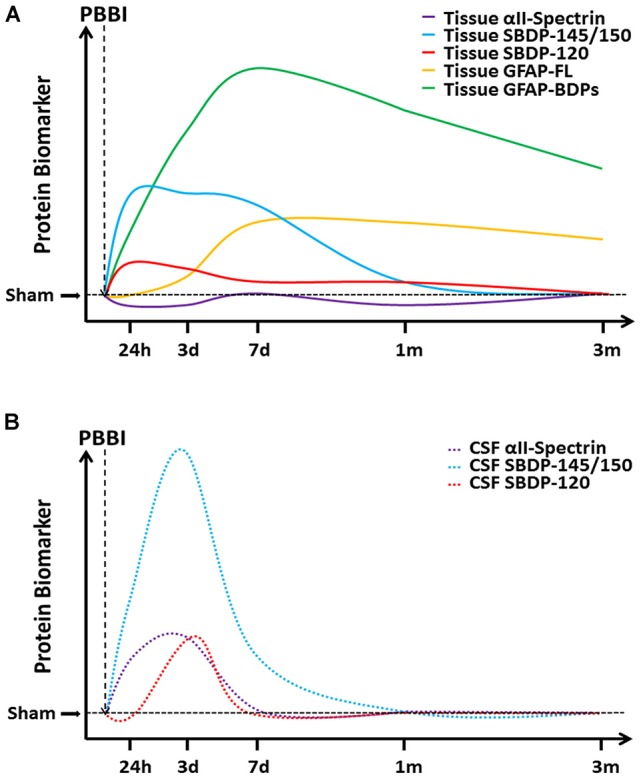
Figure 7.

A cartoon timeline of protein based biomarkers following PBBI. Changes in protein biomarker levels are presented here for (A) tissue proteins and (B) CSF proteins as indicated, with increasing time on the x-axis and increasing protein abundance on the y-axis. Please note that axes are not drawn to scale and that these curves have been approximated from PBBI rats, with tissue curves representing changes in the brain regions of the immediate injury trajectory (frontal cortex and striatum).
