
Figure 5.
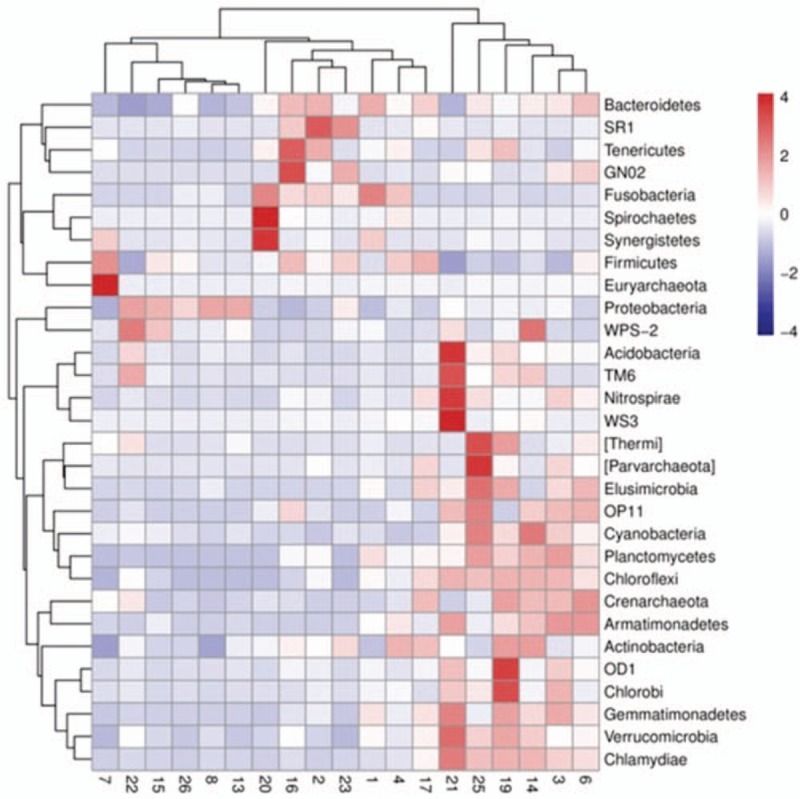
Heat-map of the top 30 bacteria at phylum level. Abundance of microbiota from both 11 OSA patients and normal subjects BALF samples was analyzed by Z-score as described in the Materials and methods. Vertical axis: sample clustering; horizontal axis: phylum clustering.