
Figure 3.
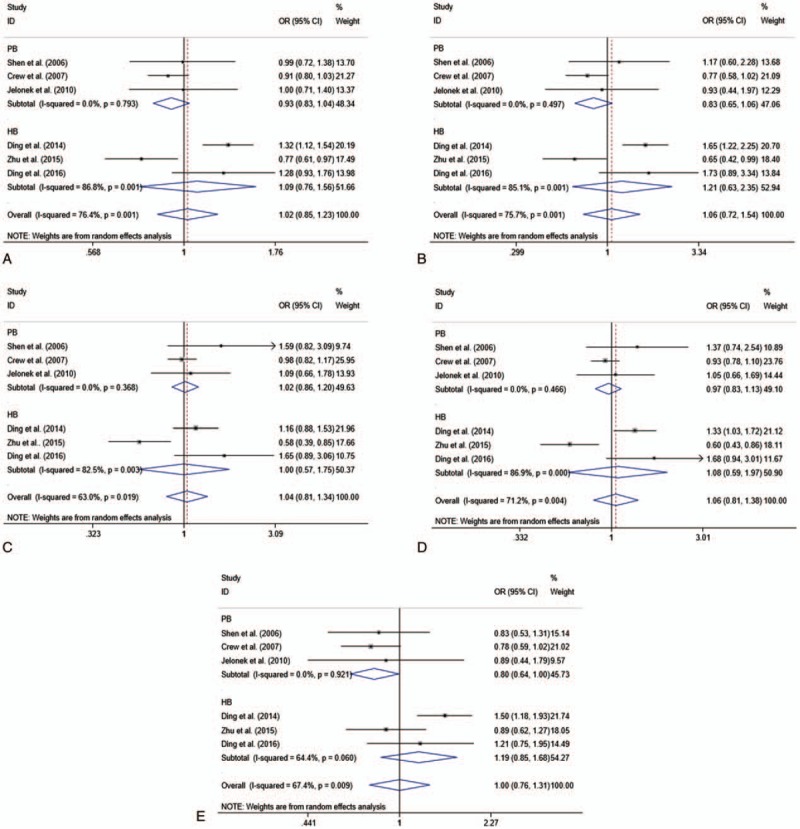
Forest plots of source of controls subgroup analysis for the association between XPA rs1800975 polymorphism and breast cancer risk. A, codominant genetic model; B, homozygous genetic model; C, heterozygous genetic model; D, dominant genetic model; and E, recessive genetic model. CI = confidence interval, HB = hospital-based, OR = odds ratio, PB = population-based.