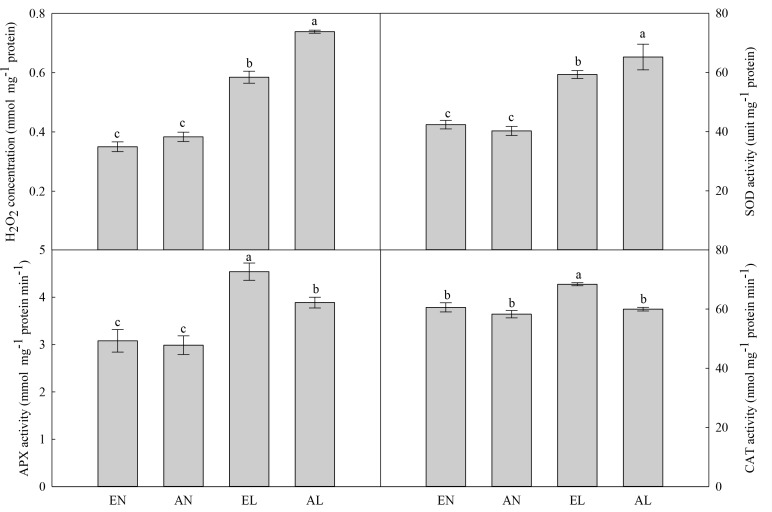
FIGURE 4.
Concentration of H2O2 and activities of SOD, APX, and CAT in the flag leaf in wheat as affected by cold stress and elevated CO2. Abbreviations of treatments are explained in Figure 1. Different small letters mean significant difference at P < 0.05 level.

