Figure 1.
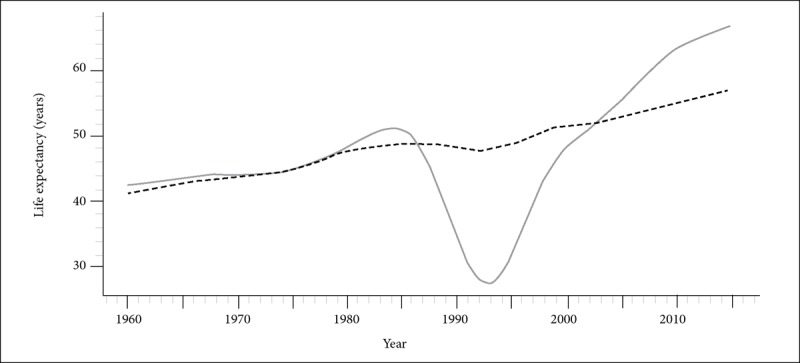
Life expectancy at birth in Rwanda (solid) and Burundi (dotted), 1960–2015

Source: World Bank’s World Development Indicators
Life expectancy at birth in Rwanda (solid) and Burundi (dotted), 1960–2015

Source: World Bank’s World Development Indicators