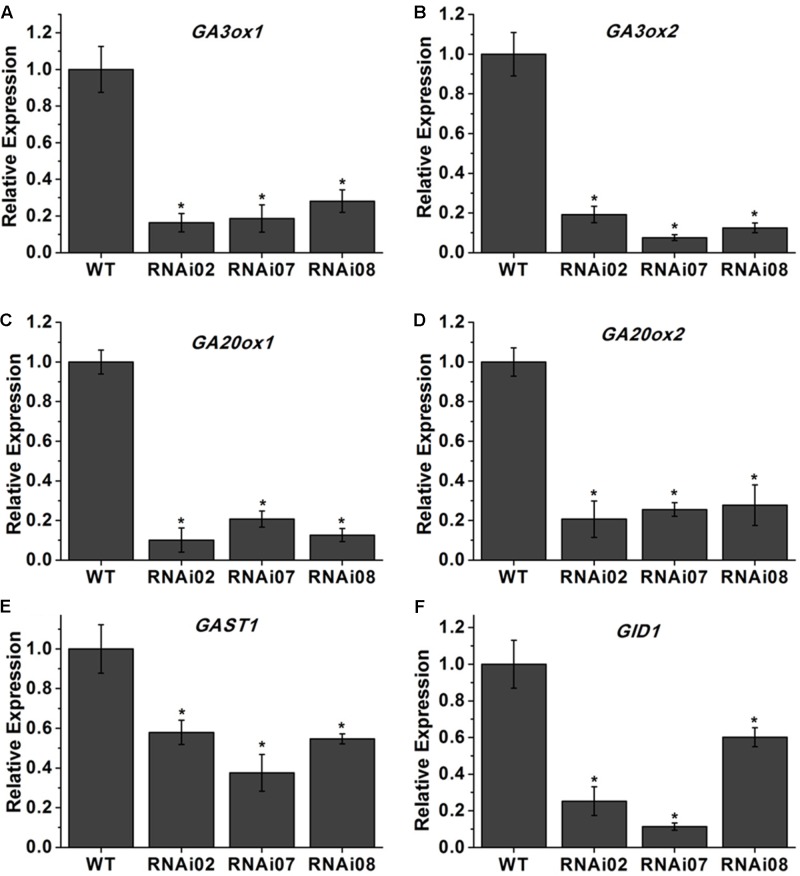
FIGURE 4.
Relative expression of genes involved in GA biosynthesis. (A–F) The expression levels of GA3ox1, GA3ox1, GA20ox1, GA20ox2, GAST1 and GID1 in wild-type and transgenic lines. Each value represents the mean ± SE of three biological replicates. Asterisks indicate a significant difference (P < 0.05).

