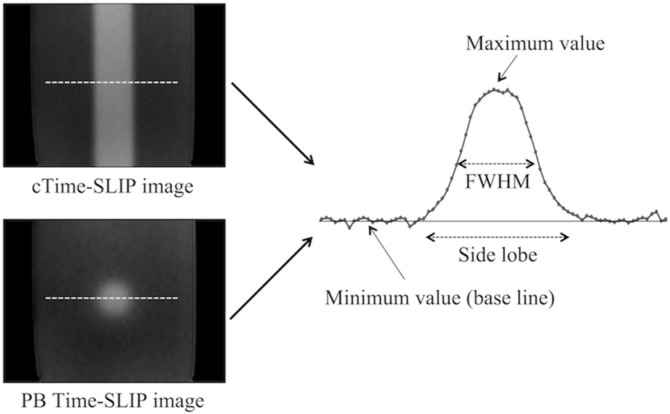
Fig. 2.
A schema for signal profile for measuring the side lobe and the full width at half maximums (FWHM). The signal profile was obtained at the dash line on each time-spatial labeling inversion pulse (Time-SLIP) image. cTime-SLIP, conventional Time-SLIP; PB Time-SLIP, time-spatial labeling inversion pulse with pencil beam pulse.

