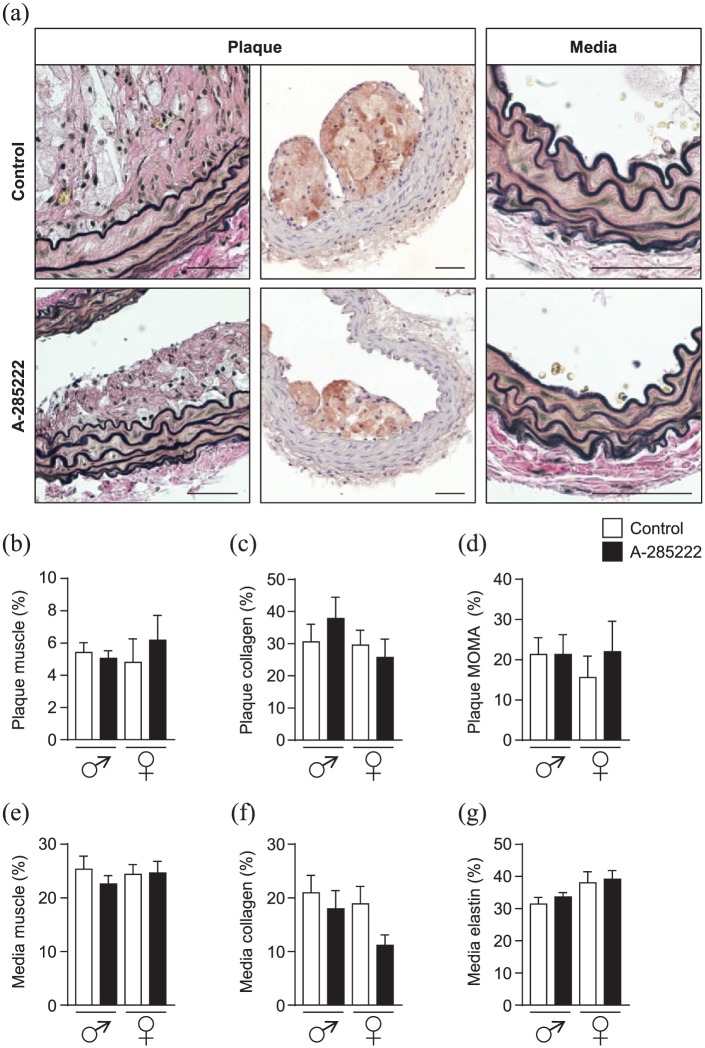
Figure 2.
Composition of atherosclerotic plaques. (a) Representative images showing plaque and media regions of brachiocephalic arterial sections from young mice in Study I, stained with Elastin van Gieson (left and right panels in each row) and MOMA-2 (middle panels). Sections from control mice are shown in the upper row, while sections from A-285222 treated mice are shown in the lower row. Graphs summarize morphometric data showing plaque (b) to (d) and media (e) and (f) composition. Muscle (b) and (e), collagen (c) and (f), macrophage (d) and elastin (g) contents in µm2 are expressed as percentage of plaque area. N = 7–8 mice/group; scale bars = 50 µm.

