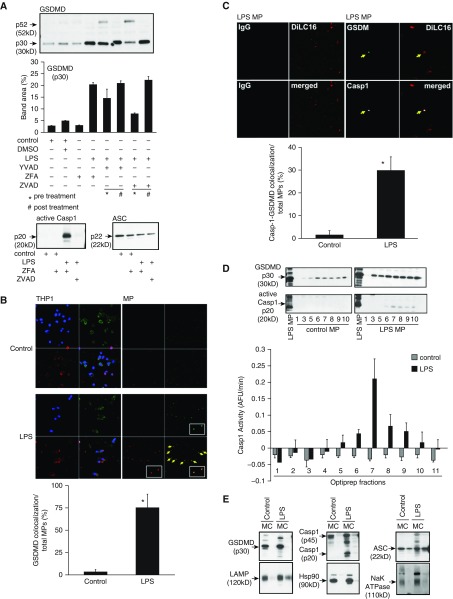
Figure 1.
Cleaved gasdermin D (GSDMD) colocalizes with active caspase 1 (Casp1) in microparticles (MPs) released from LPS-stimulated THP-1 cells. THP-1 cells were cultured at a concentration of 50 million per milliliter and stimulated with LPS (1 μg/ml) for 2 hours or left untreated. Casp1 inhibitor Y-VAD and pan-caspase inhibitor Z-VAD were used both before and after LPS treatment as indicated. DMSO and Z-FA were used as inhibitor controls. MPs were isolated from each condition and normalized by total protein for analysis. (A) Immunoblots of GSDMD, p20 caspase 1, and ASC from MPs after various treatments. Densitometric scan analysis using ImageJ software (NIH) with immunoblots is representative of four experiments. (B) Cells and MP fractions were analyzed by fluorescence microscopy for colocalization of GSDMD with MPs recovered from control and LPS-treated THP-1 cells. Cells and MPs were stained with DilC16 (lipid stain, red), GSDMD (green), and DAPI (blue). (C) Colocalization of Casp1 and GSDMD in MPs visualized by fluorescence microscopy with DiLC16 (red), GSDMD (green), and Casp1 (white). Quantification of colocalization of GSDMD with MPs was calculated as the percentage of the number of MPs colocalized with GSDMD among the total number of MPs in each field. Quantification of colocalization of Casp1 with GSDMD in MPs was calculated as the percentage of the number of MPs colocalized with Casp1 and GSDMD among the total number of MPs in each field. (D) OptiPrep fractions of control and LPS MPs were analyzed for p30 GSDMD and active p20 Casp1. Casp1 activity in each fraction was determined by fluorimetry of WEHD-afc cleavage. (E) Control and LPS MPs were further fractionated into membrane (M) and MP content (C). Both membrane and content fractions from control and LPS MPs were then analyzed by immunoblotting for p30 GSDMD, Casp1, ASC, LAMP, Hsp90, and Na+/K+-ATPase. *P < 0.05; arrow shows colocalization, inset is 100× magnification. Data are representative of four experiments. AFU = arbitrary fluorescence units.

