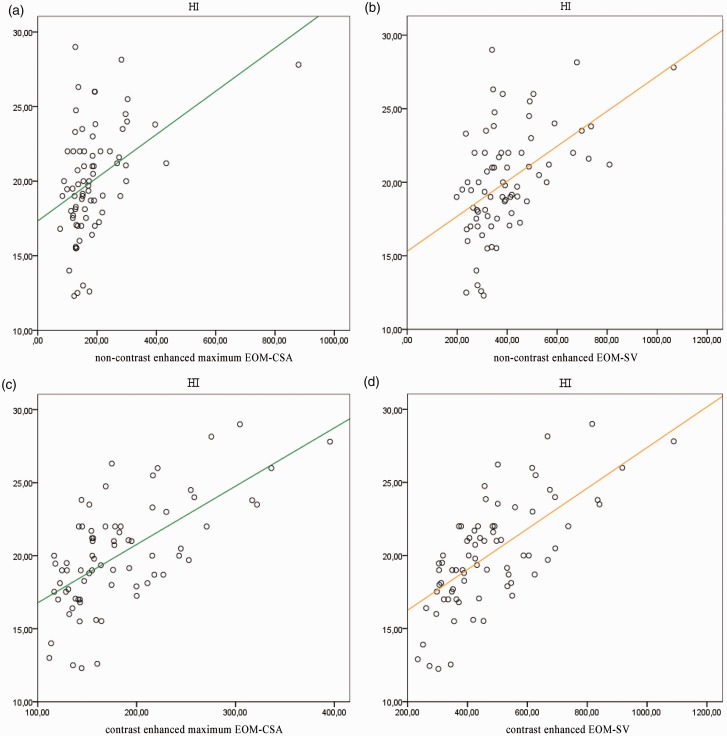
Fig. 4.
Scatter plot showing the linear regression lines between the HI and extraocular muscle sampled volume (EOM-SV, orange line) and maximum EOM-CSA (green line). The correlation is stronger with non-contrast (b) and contrast-enhanced (d) EOM-SV than with non-contrast (a) and contrast-enhanced (c) EOM-CSA. HI values are expressed in mm; EOM-CSA are expressed in mm2; EOM-SV are expressed in mm3.

