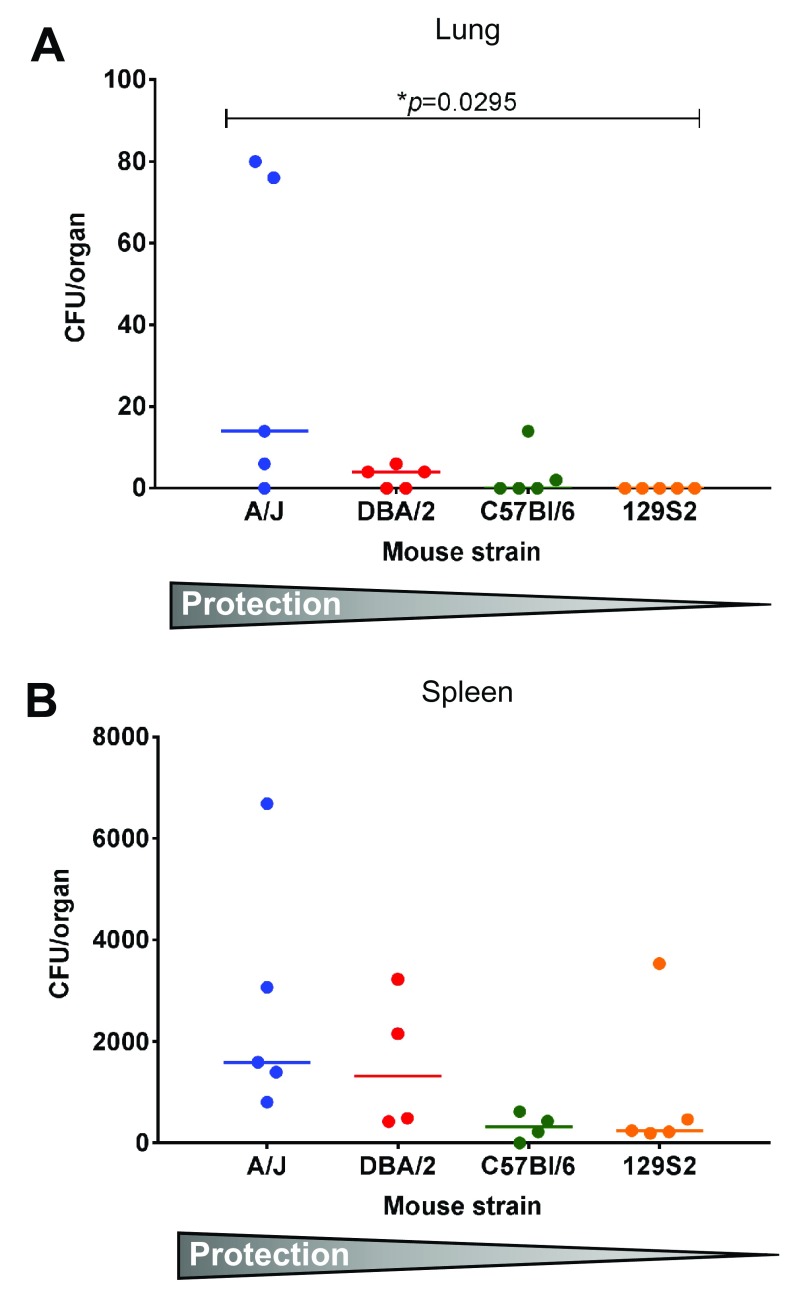
Figure 4. BCG distribution varies between lung and spleen after vaccination of ML high and ML low mice.
Approximately half of each lung ( A) and spleen ( B) was homogenised at the time of Mtb challenge (6 weeks after immunisation) and plated on 7H11 agar plates to determine viable BCG bacteria. Total CFU per organ are reported. Data sets are presented in order of decreasing protection. Each symbol represents one animal. In some instances, bacteria could not be detected and values were set to zero. p values were determined by using Kruskal-Wallis test and Dunn’s post test for multiple comparisons. Error bars represent the median and interquartile range. Multiplicity adjusted p values are reported. p<0.05 was considered statistically significant.

