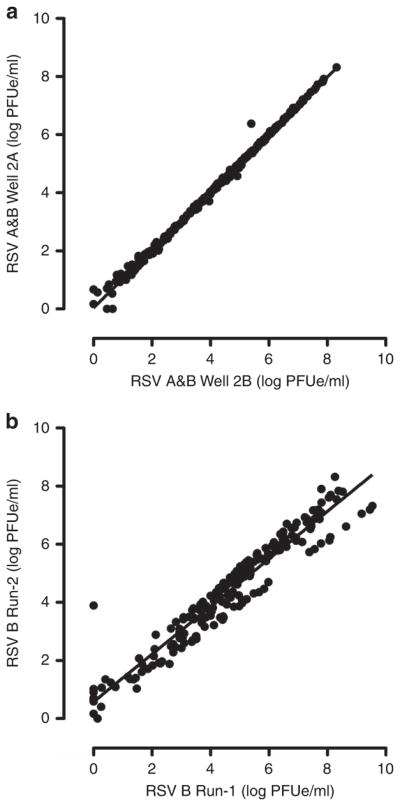
Figure 2.

Evaluation of intrinsic variability in real-time quantitative reverse transcriptase polymerase chain reaction (qRT-PCR) assay. (a) The data points represent the mean viral load values (Log PFUe/ml) in duplicate wells during run-2 for RSV-A- and RSV-B-specific assays (Figure 1). Linear regression analysis showed that there was good correlation between the log values in the duplicate wells (R2 = 0.9959). (b) The data points represent the mean viral load values (Log PFUe/ml) of duplicate wells (mean of Wells 1A and 1B, and mean of Wells 2A and 2B) from the two runs of RSV-B-specific assays (Figure 1). There was good correlation between the mean well values between qRT-PCR run-1 and run-2 (R2 = 0.9234). No subject’s qRT-PCR result on any sample switched from RSV-A to RSV-B nor from RSV-B to RSV-A.
