
Figure 6.
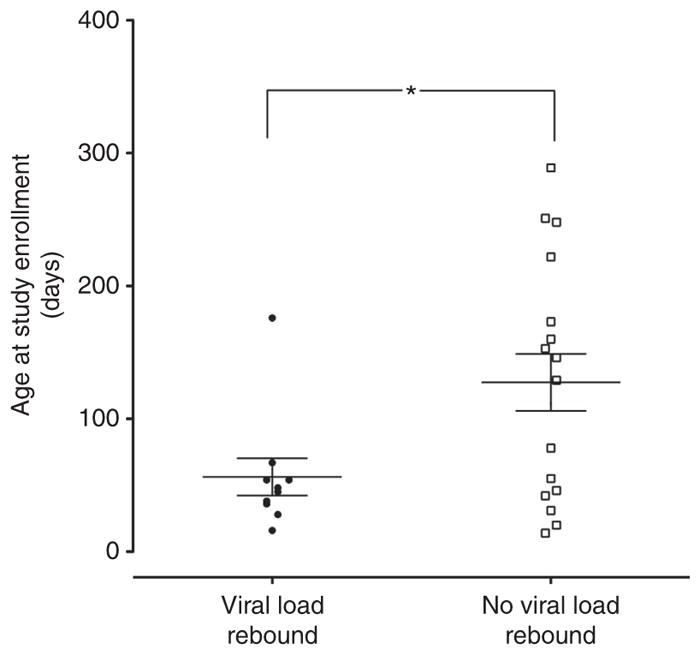
Age at study enrollment and viral load rebound. Mean age (± SD) at study enrollment for 27 screened subjects (subjects with viral load rebound, 56.2 ±14.07 days (n = 10); subjects with no viral load rebound, 127.5 ± 21.4 days (n = 17); P = 0.0259). Each data symbol represents an individual subject’s age at study enrollment. Following evaluation for Gaussian distribution using a D’Agostino Normality test, an unpaired t-test (two-tailed) was performed to compare the mean ages between the subjects with viral load rebound and the subjects with no viral load rebound; *P = 0.0259.