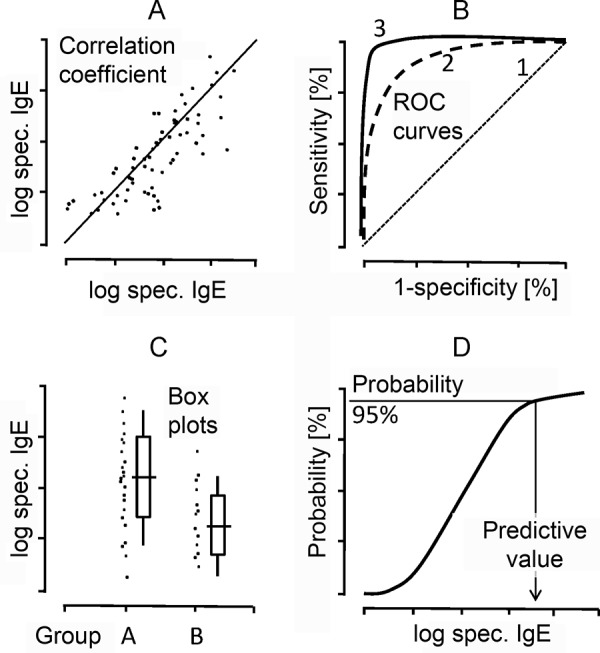
Figure 3. Typical evaluation of IgE laboratory results (e.g., using allergen molecules). A) Correlation of logarithmically distributed specific IgE concentrations (e.g., against a natural or recombinant allergen molecule). B) Diagnostic efficacy (ROC = receiver operating curves) when allergen (molecules) are used. C) Individual values, median values with 25% and 75% percentiles in between-group comparison. D) Limiting values for the prediction of clinical reactions (e.g., 95% probability of positive challenge test).

