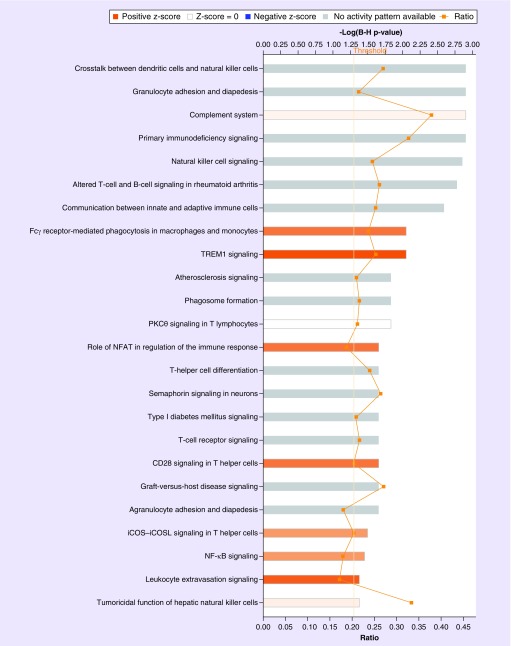
Figure 1. . Immune and inflammatory canonical pathways enriched in prostate tissue specimens from African–American men compared with European–American men.
Analysis of the 3107 differentially expressed genes (q < 0.1) using Ingenuity Pathway Analysis (QIAGEN, CA, USA) uncovered altered immune system and inflammatory signatures between these two groups. Significant enriched canonical pathways are displayed along the y-axis. The x-axis (top) displays the -log of the p-value (calculated by Fisher's exact test right-tailed and adjusted for false discovery rate using Benjamini–Hochberg. Taller bars correspond to increased pathway significance. Orange colored bars indicate pathway activation in African–American relative to European–American. White bars indicate significant pathways in African–American compared with European–American that are neither activated nor inhibited. Gray bars indicate pathways that are significant but no prediction as to their activation or inhibition can be made. The orange points connected by a thin line represent the ratio (x-axis bottom). The ratio is calculated as follows: the number of genes in a particular pathway that are significantly enriched in the RNA-seq dataset are divided by the total number of genes that make up that pathway and are present in the reference gene set.

