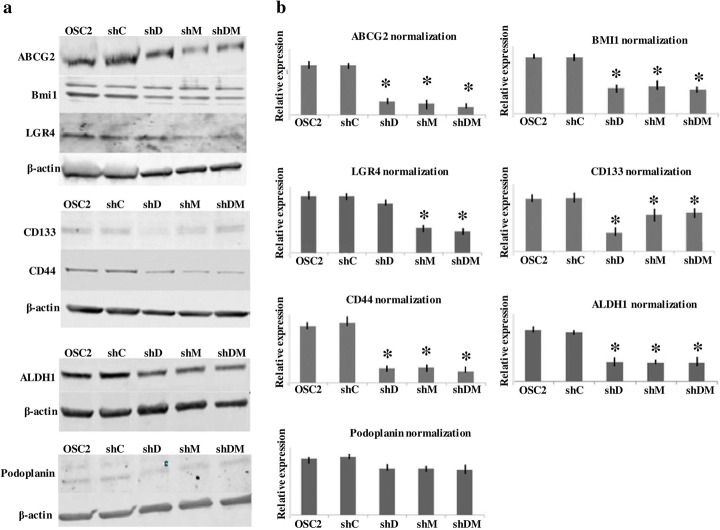
Fig. 2.
Western blot (WB) analyses of OCSC markers in DSPP-MMP20 silenced OSC2 cells (a). Normalization of ALDH1, ABCG2, BMI1, Podoplanin (PDPN), CD44, CD133 and LGR4 protein levels was with β-actin . Y- (vertical) axis of histograms represent expression level for each protein relative to β-actin (b). OSC2 = parent (untreated) cells; shC = control (scramble sequence) cells; shD = DSPP silenced cells; shM = MMP20 silenced cells; shDM = combined DSPP-MMP20 silenced cells. *p < 0.05 compared with ShC. Experiments were performed in triplicate

