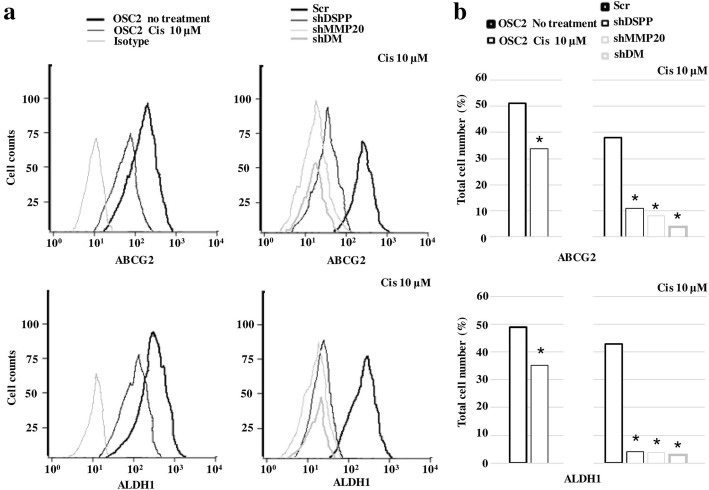
Fig. 4.
Flow cytometry analysis of ABCG2 and ALDH1 positive cell population following cisplatin treatment. Treatment with cisplatin was for 72 h at a concentration of 10 μM. a Representative flow cytometric histograms of ABCG2 and ALDH1 expression. Samples were analyzed after exposure to primary antibodies, and an Alexafluor-488 conjugated secondary antibody. Total cell count is depicted on the y-axis. Left: Isotype control antibody alone (light grey), OSC2 (untreated) cells (heavy black), and OSC2 treated (light black). Right: Scr = control (heavy black), shDSPP silenced cells (light black), shMMP20 silenced cells (light grey) and shDM combined DSPP-MMP20 silenced cells (heavy grey). All histograms show the distribution of fluorescence intensity (x-axis), reported as arithmetic means. b Quantification of ABCG2 and ALDH1 positive OSC2 cell population, presented as percentage (%) of total cell number. Statistically significant lower percentages (*p < 0.05) of ABCG2 and ALDH1 positive cell were noted in cisplatin-treated compared with untreated OSC2 cells, as well as in shDSPP, shMMP20 and shDM cells compared to scramble control (Scr) cells, respectively. Experiments were performed in triplicate

