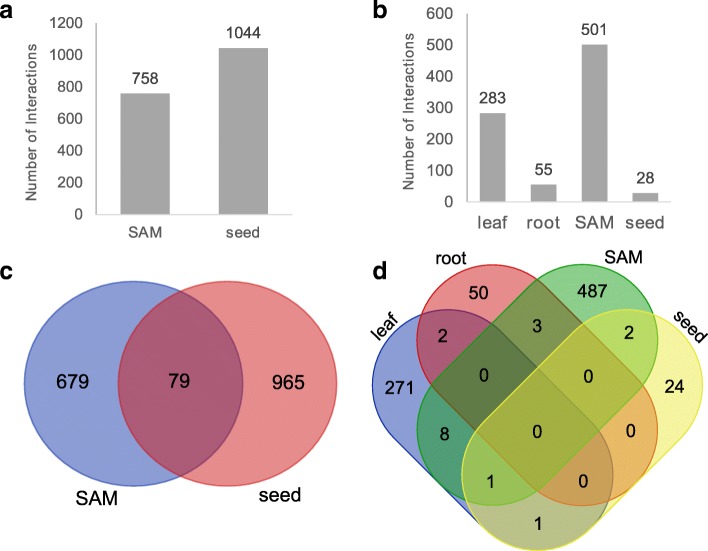
Fig. 2.
Target prediction of top 1 million edges for Knotted1 (KN1) (a and c) and Fasciated ear4 (FEA4) (b and d) in different tissues. a Number of predicted KN1 targets in each tissue-specific GRN. b Number of predicted FEA4 targets in each tissue-specific GRN. c A Venn diagram showing the overlap of KN1 targets between the SAM and seed GRN. d A Venn diagram showing the overlap of FEA4 targets between the four tissue-specific GRNs

