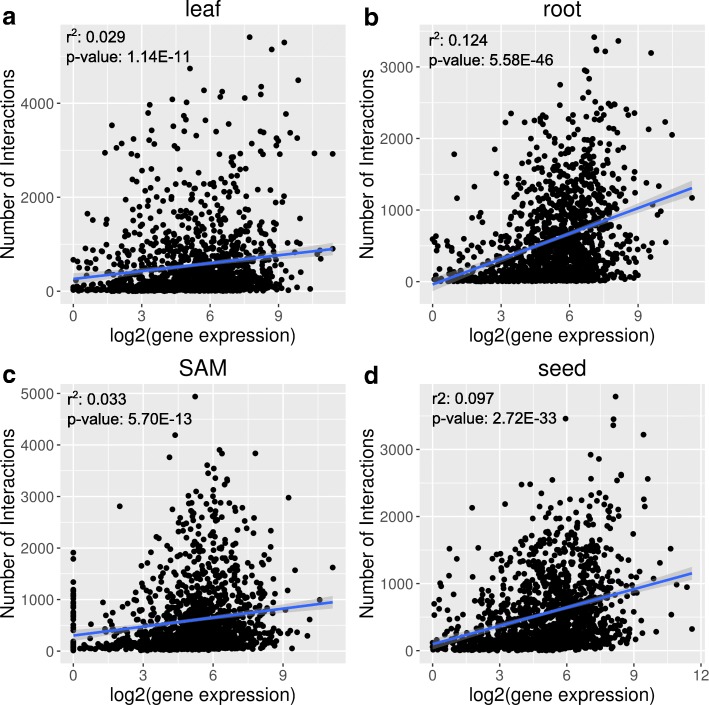
Fig. 5.
Effect of gene expression (calculated by log2(CPM + 1)) on the number of interactions for TFs in (a) Leaf GRN, (b) Root GRN, (c) SAM GRN, (d) Seed GRN. Linear regressions were plotted in blue lines with a grey band as the 95% confidence intervals. R2 and p-values were calculated from the linear models by lm() function in R

