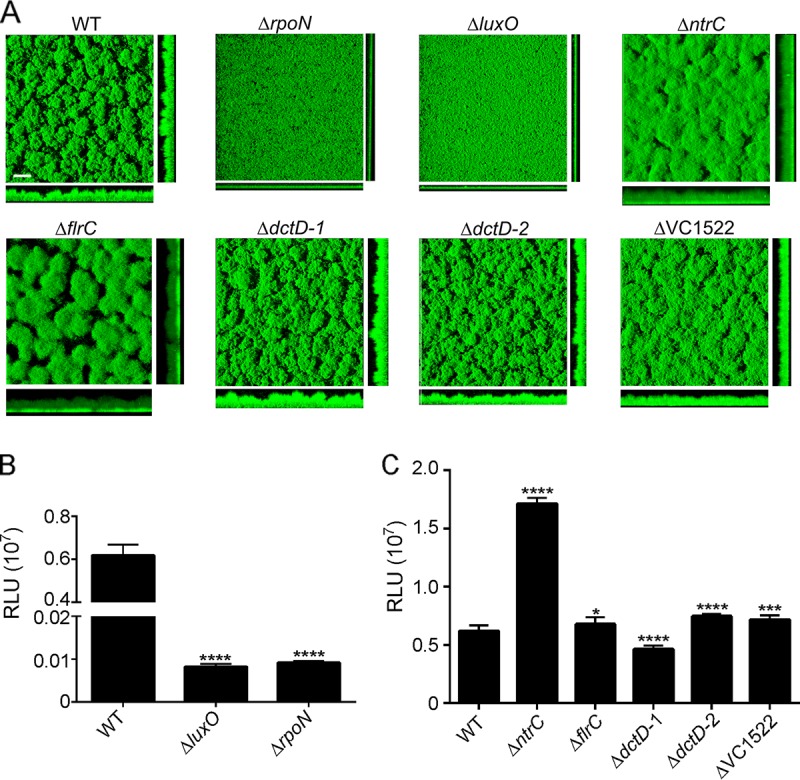
FIG 1.

Analysis of biofilm formation and vpsL expression in NtrC family RR deletion mutants. (A) Three-dimensional biofilm structures of V. cholerae wild-type (WT), ΔrpoN, ΔluxO, ΔntrC, ΔflrC, ΔdctD-1, ΔdctD-2, and ΔVC1522 strains after 48 h of incubation in flow cell chambers. Images of horizontal (xy) and vertical (xz) projections of biofilms are shown. The results shown are from one representative experiment of three independent experiments. Bar = 30 μm. (B) Expression of PvpsL-luxCADBE (pFY_0950) in the WT, ΔluxO, and ΔrpoN strains The graph represents the averages and standard deviations of relative light units (RLU) obtained from four technical replicates from two independent biological samples. RLU are reported in luminescence counts per minute per milliliter per OD600. One-way analysis of variance (ANOVA) followed by Dunnett's multiple-comparison test was used to compare expression levels between the WT and deletion mutants. ****, P < 0.0001. (C) Expression of PvpsL-luxCADBE (pFY_0950) in the WT, ΔntrC, ΔflrC, ΔdctD-1, ΔdctD-2, and ΔVC1522 strains. The graph represents the averages and standard deviations of RLU obtained from four technical replicates from two independent biological samples. RLU are reported in luminescence counts per minute per milliliter per OD600. One-way ANOVA followed by Dunnett's multiple-comparison test was used to compare expression levels between the WT and deletion mutants. *, P < 0.05; ***, P < 0.001; ****, P < 0.0001.
