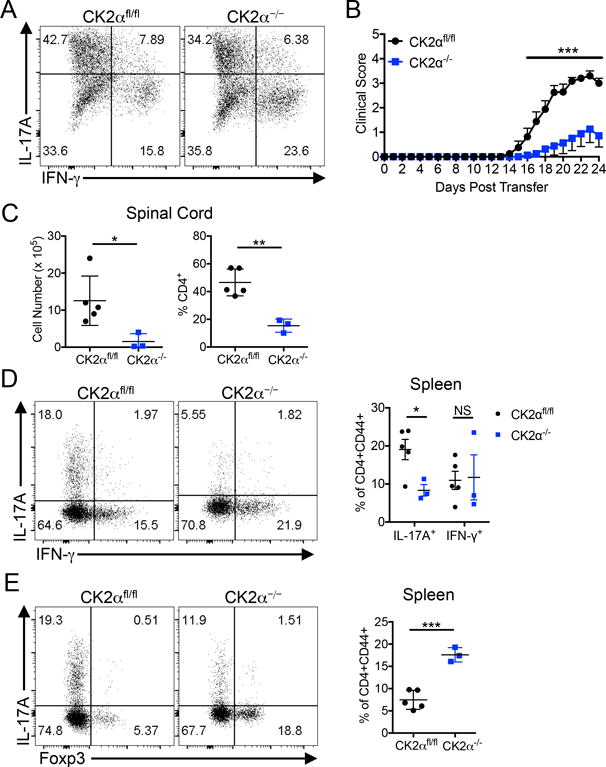
Figure 6. CK2α promotes Th17 Cell Pathogenicity in Adoptive Transfer EAE.

(A) CK2αfl/fl and CK2α−/− mice were immunized, and on days 10-14 P.I, lymph nodes cultured in Th17 conditions. Cytokine production was determined by flow cytometry. A representative plot from 3 separate experiments is shown. (B) Cells were adoptively transferred into Rag1−/− recipients, and recipient mice scored daily; n=8 mice/group. (C) At disease peak, mononuclear cells were enriched from the spinal cords, counted, and CD4 expression detected by flow cytometry. (D) At disease peak, effector T cells from the spleens were stained for IL-17A and IFN-g. Representative flow plots and combined frequencies of total IL-17A+ and IFN- g+ CD4+CD44+ T cells are shown. (E) Tregs in the spleens of recipient mice were identified by Foxp3. Representative flow plots and combined frequencies of Foxp3+ cells are shown; CK2afl/fl, n = 5; CK2a−/−, n = 3. * p<0.05, ** p<0.01, *** p<0.001.
