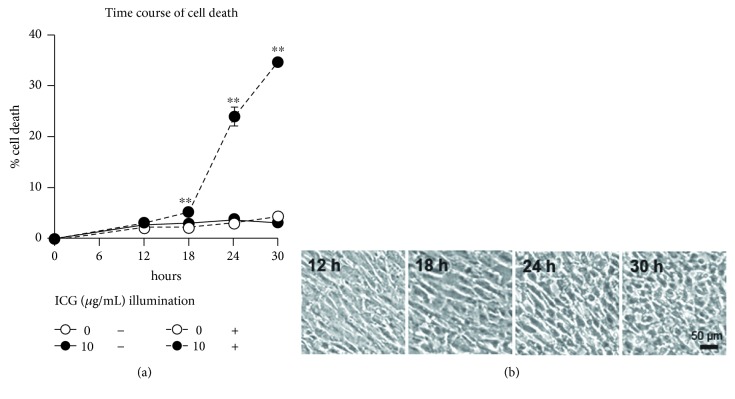
Figure 1.
Time course of cell death rate and morphological changes cultured in the dark or under illumination. (a) Percentages of dead cells were measured by LDH activities in culture supernatants and cell lysates at indicated periods. The values of cell death in experimental cultures were compared with those in culture with 0 μg/mL ICG in the dark. (b) Phase-contrast micrographs of cultures with 10 μg/mL ICG under illumination at indicated periods. Dunnett's test: ∗∗P < 0.01.

