Figure 6.

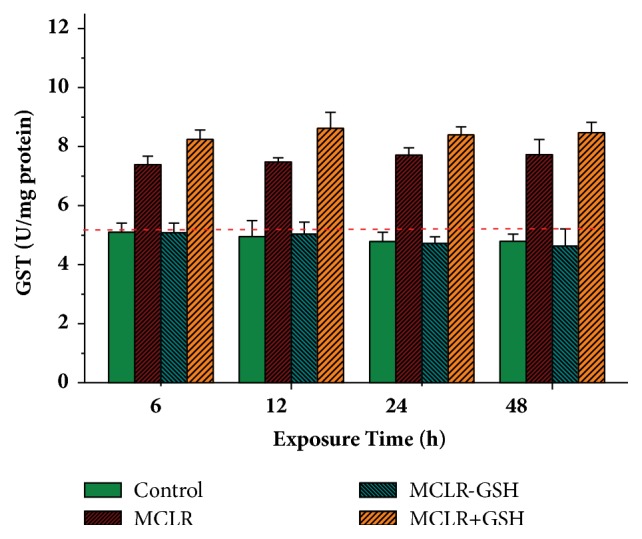
Influence of MCLR, MCLR+GSH, and MCLR-GSH on cellular GST activity in HepG2 cells. Conditions: MCLR 20 nM/L, MCLR-GSH 20 nM/L, and GSH 2 mM/L; the dash lines correspond to the original data for control samples at 0 h.

Influence of MCLR, MCLR+GSH, and MCLR-GSH on cellular GST activity in HepG2 cells. Conditions: MCLR 20 nM/L, MCLR-GSH 20 nM/L, and GSH 2 mM/L; the dash lines correspond to the original data for control samples at 0 h.