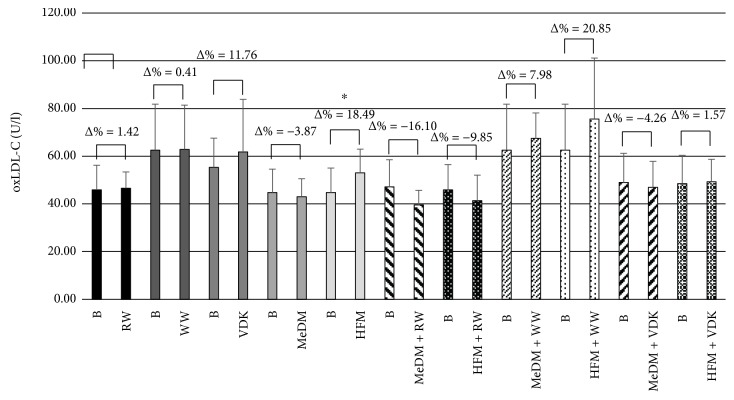
Figure 2.
Variation of oxLDL-C levels between baseline and treatments. Comparative values of oxLDL-C levels for each treatment intervention. The significant values are expressed as B versus HFM (∗ p < 0.05). B: baseline; RW: fasting red wine; WW: fasting white wine; VDK: fasting vodka; MeDM: Mediterranean meal; HFM: high-fat meal; MeDM + RW: Mediterranean meal plus red wine; MeDM + WW: Mediterranean meal plus white wine; MeDM + VDK: Mediterranean meal plus vodka; HFM + RW: high-fat meal plus red wine; HFM + WW: high-fat meal plus white wine; HFM + VDK: high-fat meal plus vodka.

