Figure 2.
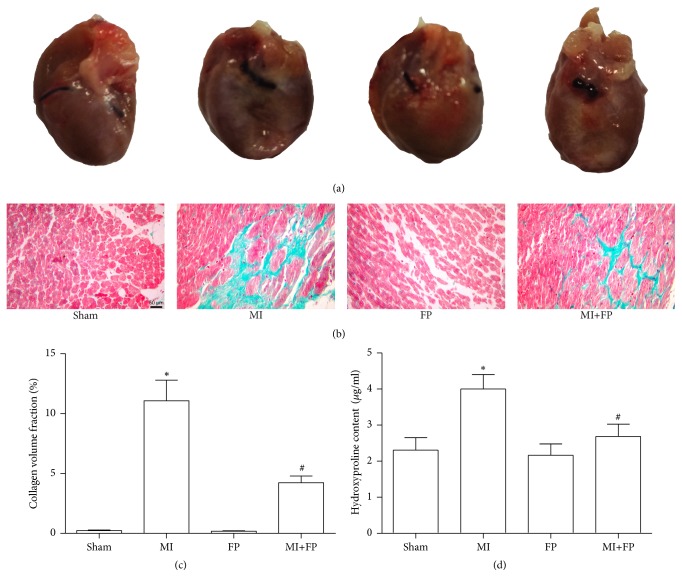
FP reduced cardiac fibrosis in the LV noninfarct region after MI. (a) Representative images showing morphological changes of rat hearts from the sham, MI, FP, and MI+FP groups. (b) Representative images showing cardiac fibrosis evaluated by Masson's trichrome staining. (c) Quantitative analysis of (b). (d) The hydroxyproline content was assayed in the LV of rats from the sham, MI, FP, and MI+FP groups. The results are expressed as the mean ± SEM; n = 6 per group; ∗P < 0.05 versus the sham group; #P < 0.05 versus the MI group.

