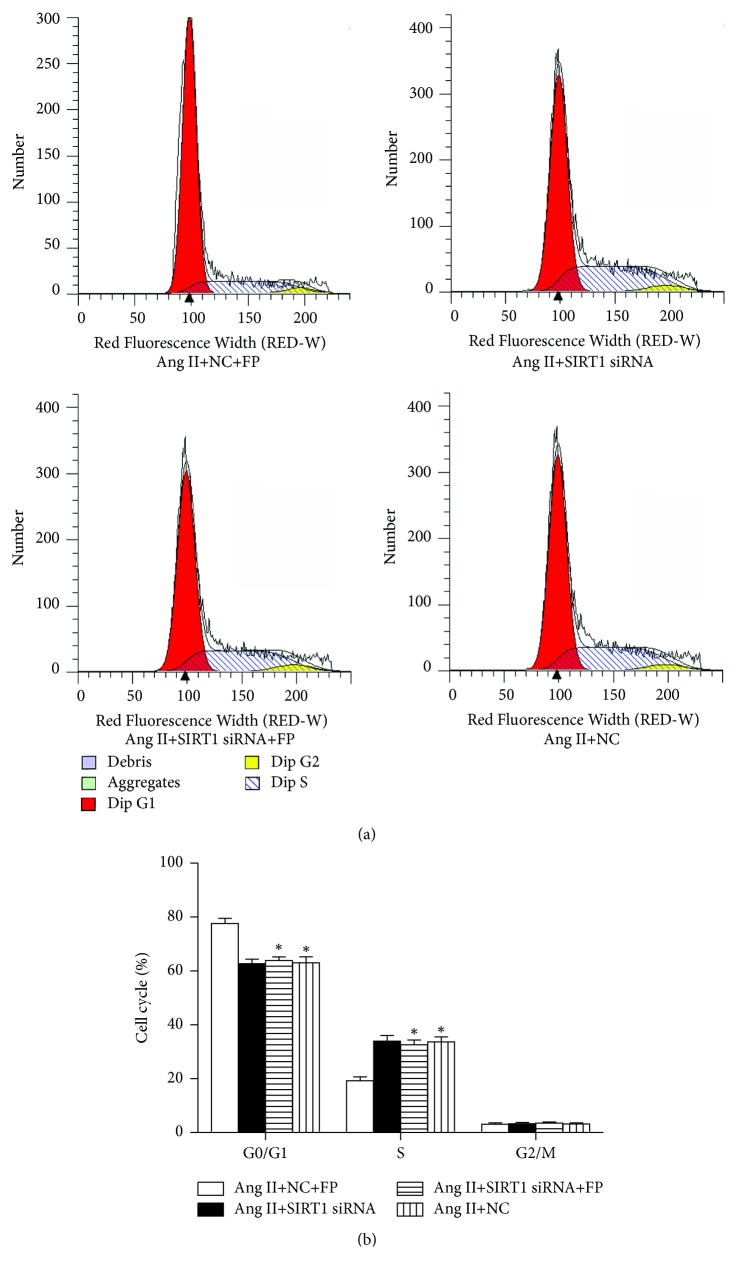
Figure 8.
SIRT1 knockdown inhibited the effect of FP on the cell cycle distribution of CFs induced by Ang II. (a) Representative images showing the distribution of the G0/G1, S, and G2/M phases of each group. (b) Quantitation of the percentages of cell numbers in the G0/G1, S, and G2/M phases of each group. Data are expressed as the mean ± SEM; n = 6 per group. ∗P < 0.05 versus the Ang II+NC+FP group.

