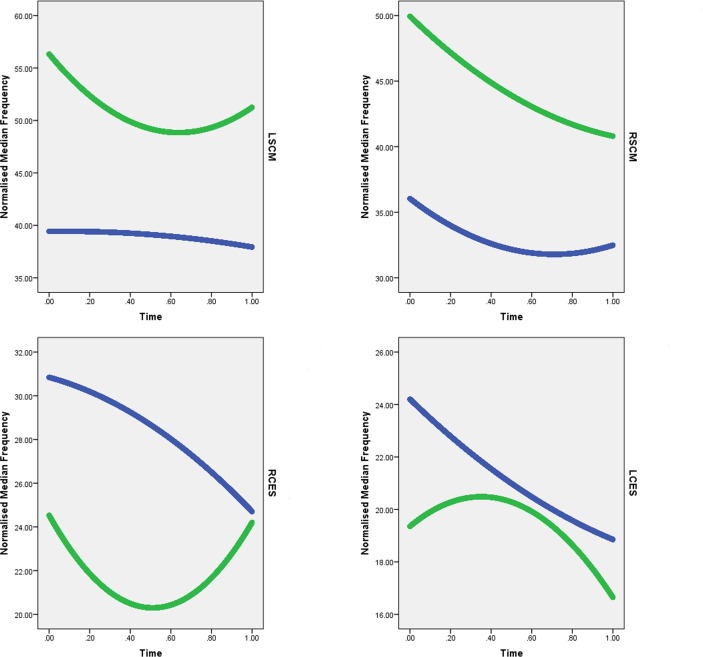
Figure 2.
Conditional growth curves for LSCM (top left), RSCM (top right), LCES (bottom left) and RCES (bottom right) showing the change in NMF over time with the halo-type structure (green) and without the halo-type structure (blue). LCES, left cervical erector spinae; LSCM, left sternocleidomastoid; NMF, normalised median frequency; RCES, right cervical erector spinae; RSCM, right sternocleidomastoid.

