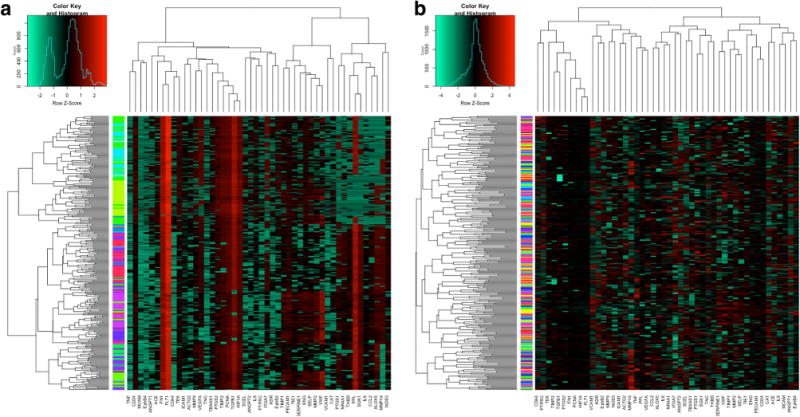
Fig. 3.

HAC heat maps. Hierarchical heat map plotted with genes clustered as column-wise dendrogram and cells clustered as row-wise dendrogram using triple-positive data (a). Color bars indicate the patient χw ID by which cells were sampled. The same analysis done using the data (b)
