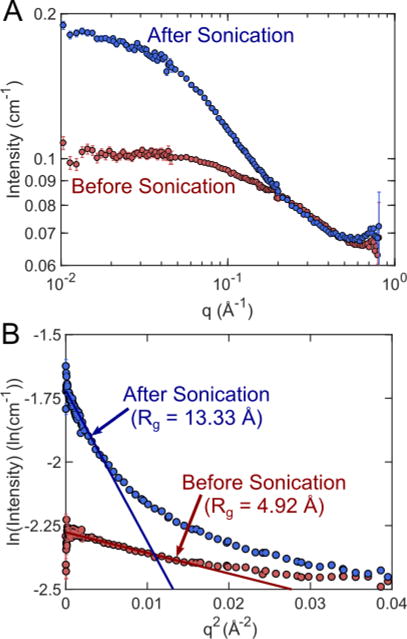
Figure 11.

(A) SANS measurements before and after sonication at 6.8 MPa. A significant change in scattering intensity was observed in the low-q region after sonication, indicating larger structures present in the sample. (B) Gunier analysis confirmed that the radius of gyration in the sample increased from 4.92 Å to 13.33 Å due to insonation.
